How High Can the Bitcoin Price Go this Cycle?

TL;DR How high can the Bitcoin price go this cycle (2021-2025)? While predicting the exact top is of course impossible, we can make some educated guesses. Let’s look at the catalysts that drive this bull market, draw some charts comparing this cycle to previous ones, and look at the average prediction of the analyst crowd.
One way to look at the Bitcoin price is from the angle of two financial systems – the traditional financial system and crypto. These are like communicating vessels: money can flow between the two. For crypto prices to go up, buyers need money from the traditional financial system. This money is created by central banks, who provide banks with monetary ammo to lend more.
Liquidity
A fancy word for this flow of money liquidity. In some periods, with low interest rates, quantitative easing, and stimulus checks, money from tradfi flows richer. At other times, with high interest rates and tight fiscal policy, money is sucked back into the traditional system – and crypto prices go down.
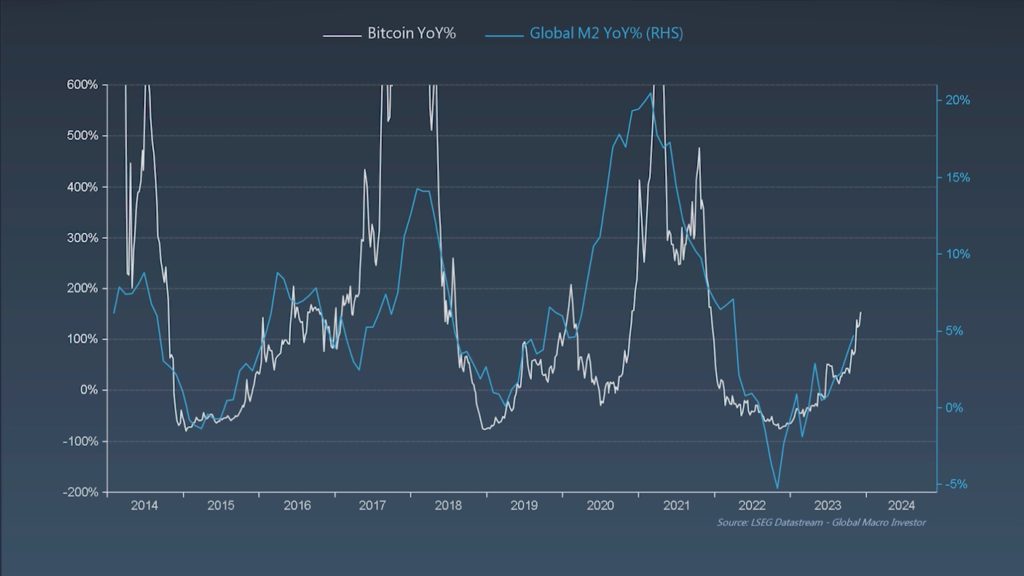
Here’s a graph by by Global Macro Investor. The common way to measure liquidity is by the so-called M2. That’s the total money supply, including all the cash people have on hand, plus all the money deposited in checking accounts and savings accounts.
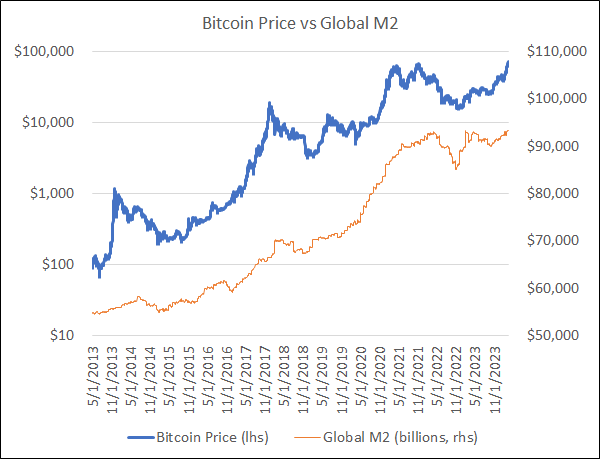
Notice the correlation between the year-on-year change between Global money supply and the change in the Bitcoin price. It’s quite straighforward: if liquidity goes up, number go up. And whenever the growth in money supply falls to zero or even gets negative, BTC gets pummeled. And then shoots back up again whenever the money printer goes brrr again.
As you can see, global M2 growth has bottomed together with BTC and is in an uptrend, just like BTC. Here’s another graph that shows the same mechanism.
The Floodgates
So that’s the monetary ebb and flow. But for money to flow into BTC and into crypto in general, you also need floodgates. Without a gate, the water can’t flow between the traditional financial system and crypto.
Here’s the BTC chart with some historical ‘floodgate launches’.
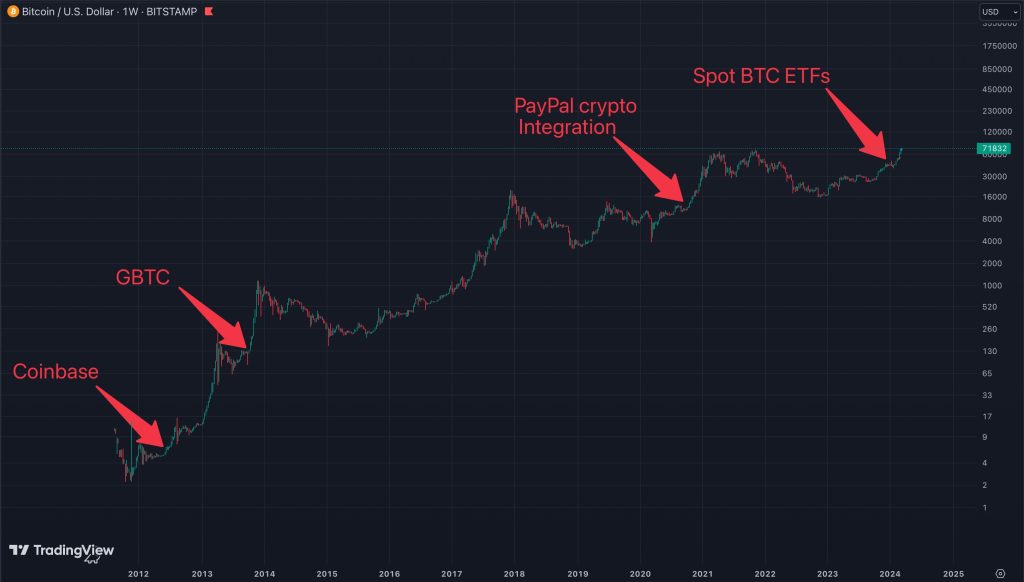
Until around 2012, when user-friendly exchanges such as Coinbase launched, it was very hard for the general public, let alone institutions, to get their hands on Bitcoin. There was no easy onramp, no floodgate.
In 2013 the Grayscale Bitcoin Trust launched, so accredited investors gained a gate to be exposed to the BTC price. The next big floodgate came in 2020 when apps such as Cash App, RobinHood and PayPal, allowed users to buy Bitcoin. The most recent floodgate – and a huge one – is the recent launch of the spot Bitcoin ETFs in the US. With a push of the button, every investor and wealth management platform can add BTC to their portfolio.
To sum up this point: incoming flood + new floodgate equals number go up.
By how much? Let’s do some technical analysis.
Power Law Corridor Model
Befofe we go into price targets of the current cycle, let’s zoom out. Here’s the Bitcoin Power Law Corridor model.
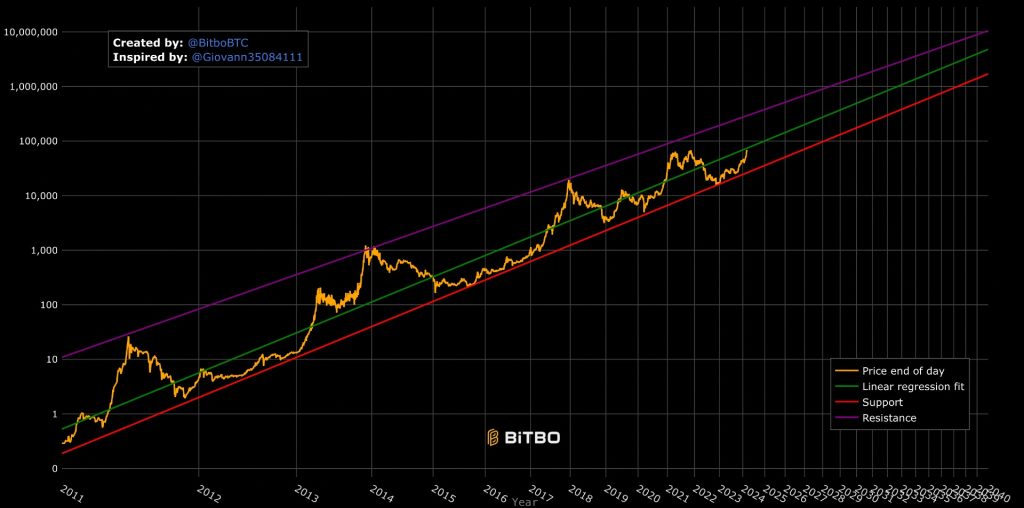
This model isn’t new but has gained renewed attention in recent months. It has been holding up well and is easy to use. Contrary to common log-linear plots, the Bitcoin Power Law uses logarithmic scales on both the x-axis and y-axis. This strips away day-to-day volatility and reveals an interesting relation between price increase and time increase.
What the model implies is that it takes Bitcoin roughly 50% extra time to go up another 10 times in value. As an example, let’s assume we will reach 100k in January 2025. That’s 16 years after Bitcoin’s launch. The time it will take BTC to reach 1 million will accoring to the model be 50% more time, so roughly another 8 years, around 2033. Applying the same power law to the early days, shows you why the price went up faster. Let’s say it took BTC 2 years to reach a dollar. Reaching the 10 dollar mark would only have cost another 50% so another year.
This model has held up since BTC was worth pennies. It posits a ‘fair value’ of 75k around the time of this recording, right around where we are. Of course there are wide uncertainty bands within the volatile price jumps up and down. At the time where most people project the top of the bull market- the second half of 2025 – the model puts the BTC price anywhere between 50K and 500k, with a fair value of 130k.
Let’s keep that in the back of our minds while looking at some other price predictions.
Diminishing Returns?
The Power Law Corridor Model shows us a straight line up but that’s only because time on the x-axis is compressed. When measured in straight months or years, it takes BTC longer and longer to reach the same percentage gains. Put in a different way: the percentage gains per 4-year cycle have diminished since the first halving.
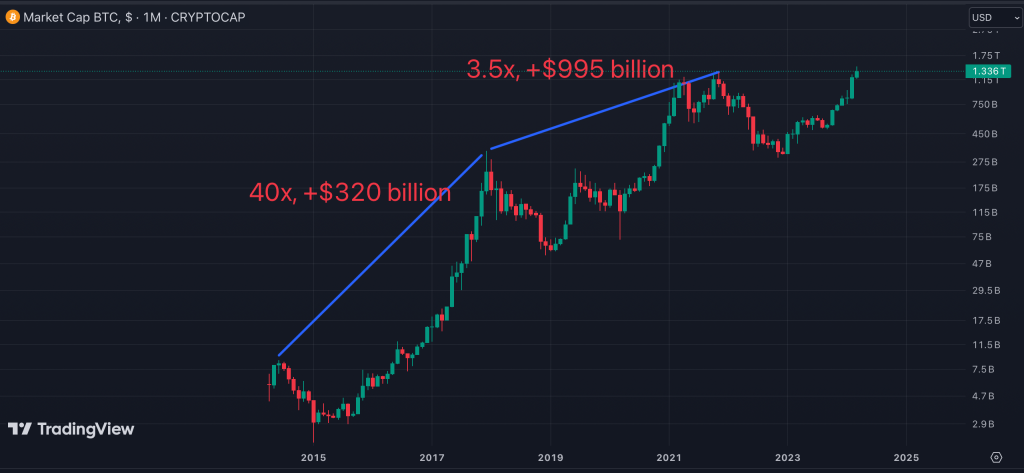
Don’t let this bum you out: in absolute terms, the gains still increase every cycle. Even though BTC’s market cap increased a 40 x from 8 Billion in 2014 to 320 billion dollars in 2017, the ‘mere’ 3.5x to 2021 meant almost another trillion extra in market cap.
What will this mean for this cycle’s top? Here’s a chart from Look into Bitcoin on which the percentage gains are plotted.
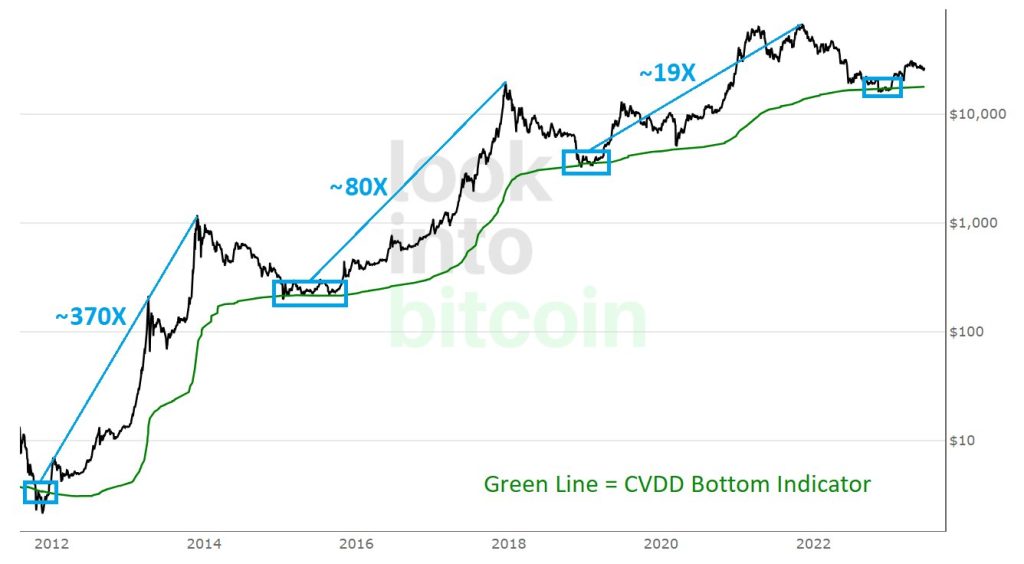
The percentage gains from bear bottom to bull top decrease with very roughly a factor 4 each cycle. So this implies a 5x for this cycle from the lows: roughly 90k.
Let’s hope we will do better – but this is just to have that rather bearish scenario out there. Now let’s move on to the more bullish way to look at diminishing returns.
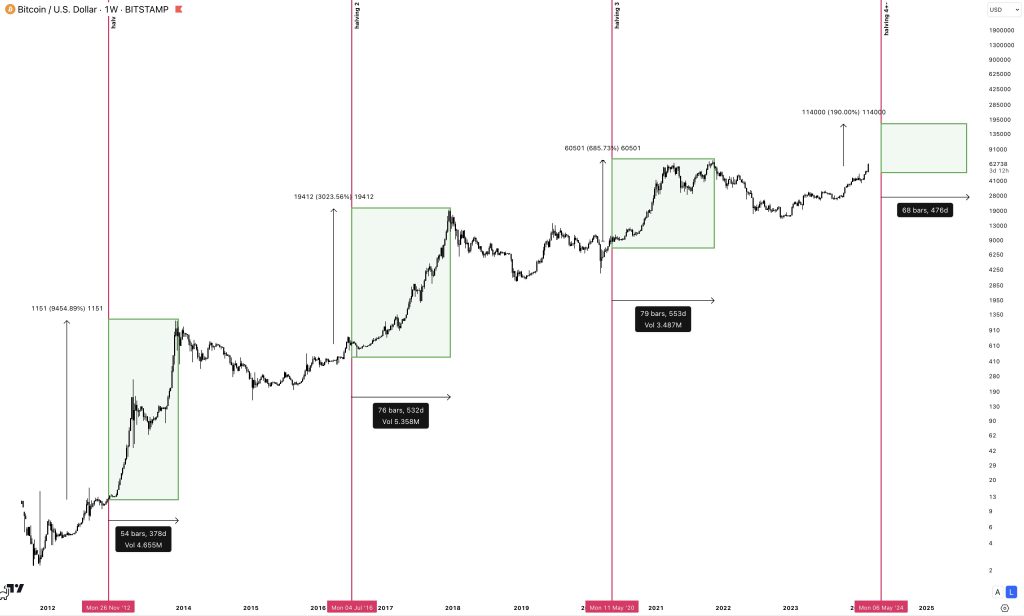
Here’s a chart by Crypto Amsterdam: unlike the previous example, he doesn’t take the bear market lows as a reference point but the halving. He notes that gains decline by about 72% per cycle post-halving. The last cycle saw roughly 700% gains post-halving. Assuming a similar pattern and decline, the potential top could be $175k, starting from a halving point of $60k.
But there’s much more to say.
Fibonacci levels
If you’ve watched videos on price predictions for crypto, or any kind of asset really, you’ve probably come across Fibonacci levels, or Fib levels for traders among each other. Whenever the price falls back or shoots up past new all-time highs, these levels correspond to certain percentage gains or losses that the price often will find support or resistance.
Fib levels are based on previous movements: prior price swings historically can sort of predict future price swings. Take the bear market of 2018 as an example. The price dropped from roughly 20k to 3k. When the bull market returned in 2020, the most used Fib level, the 1.618, for this retracement shows a price of 62k. Which is indeed roughly where the price topped out in 2021.
Applying this same logic to the upcoming all-time highs, the important 1.618 Fib level brings us to roughly 174k. That’s a 2.5x return compared to the prior bull market top, which is in line with the diminishing returns principle we talked about.
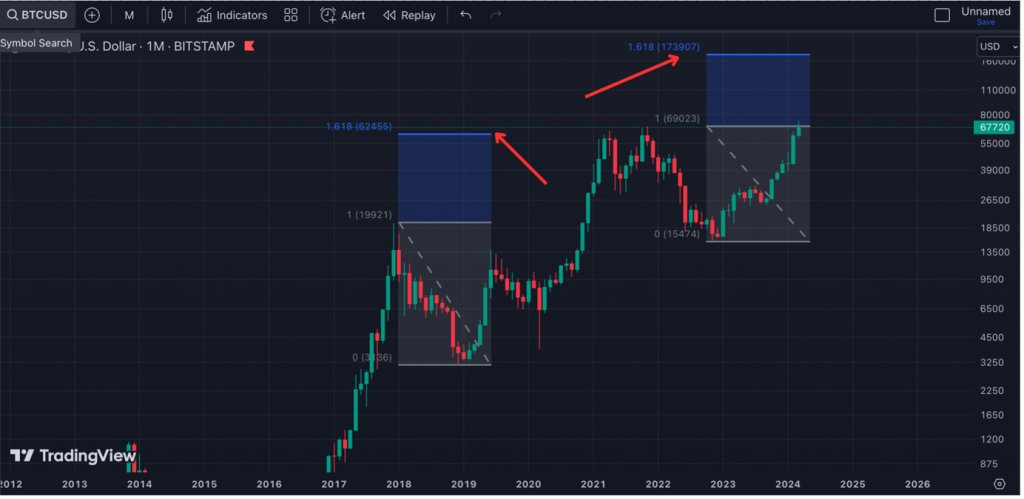
(Interestingly, these Fib levels show us that it’s Bitcoin’s volatility to the downside that makes it’s pump to the upside possible. The further BTC retraces in a bear market, the higher the 1.618 (and 2.618 and 3.618) levels will move).
Still, don’t expect this Fib level to hit with perfection. For example, based on this level, the 2017 bull market should have topped out around 4k, but it went all the way up to 20k. We can always hope it will be the same this time around.
Predictions by Renowned Analysts
Let’s go to the fun part and look at some price targets of renowned analysts, two real veterans.
Peter Brandt
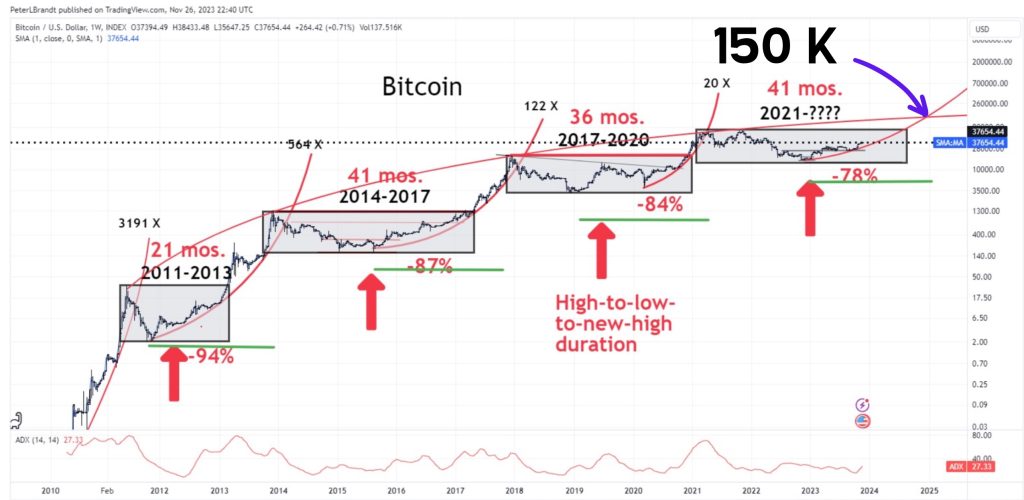
Peter Brandt already traded chart patterns of commodities like heating oil when I wasn’t even born yet. When he was shown the BTC chart a decade or so ago he admitted it traded unlike anything he had seen before. In this chart he shared with Real Vision last year, he predicted the current parabolic phase will break around 150k. In a more recent tweet he upped his target to 200k.
Raoul Pal
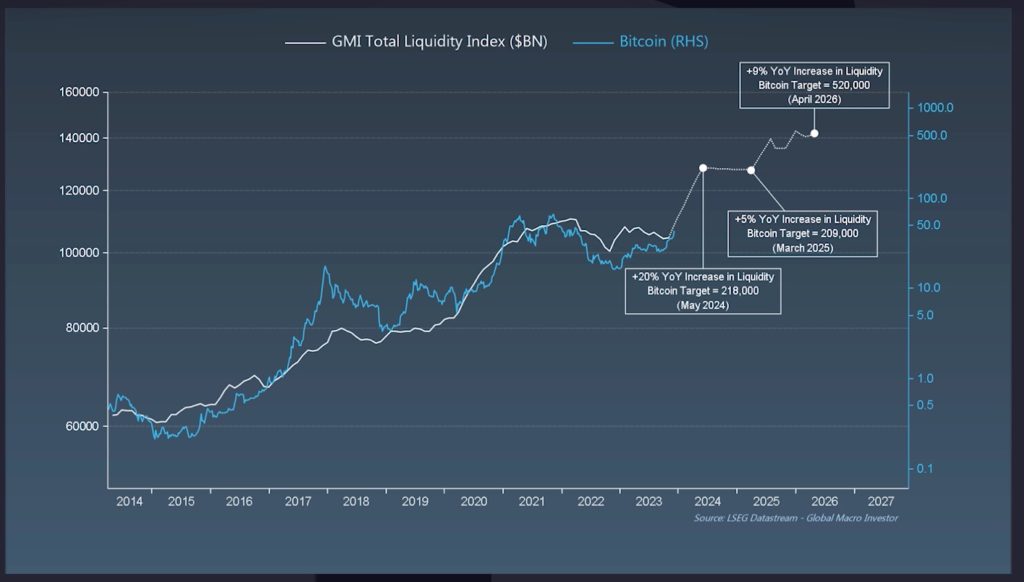
The earlier chart of global liquidity is Raoul Pal’s. This former Goldman Sachs hedge fund manager-turned crypto bull sees liquidity as the main driver of crypto prices.
His liquidity predictions lead him to chart a BTC price of already 218k in 2024, topping out at 520k in 2026, a figure even he as a vocal bull finds hard to believe. Maybe divide this figure by 2, he assesses in his own videos on the topic.
PlanB
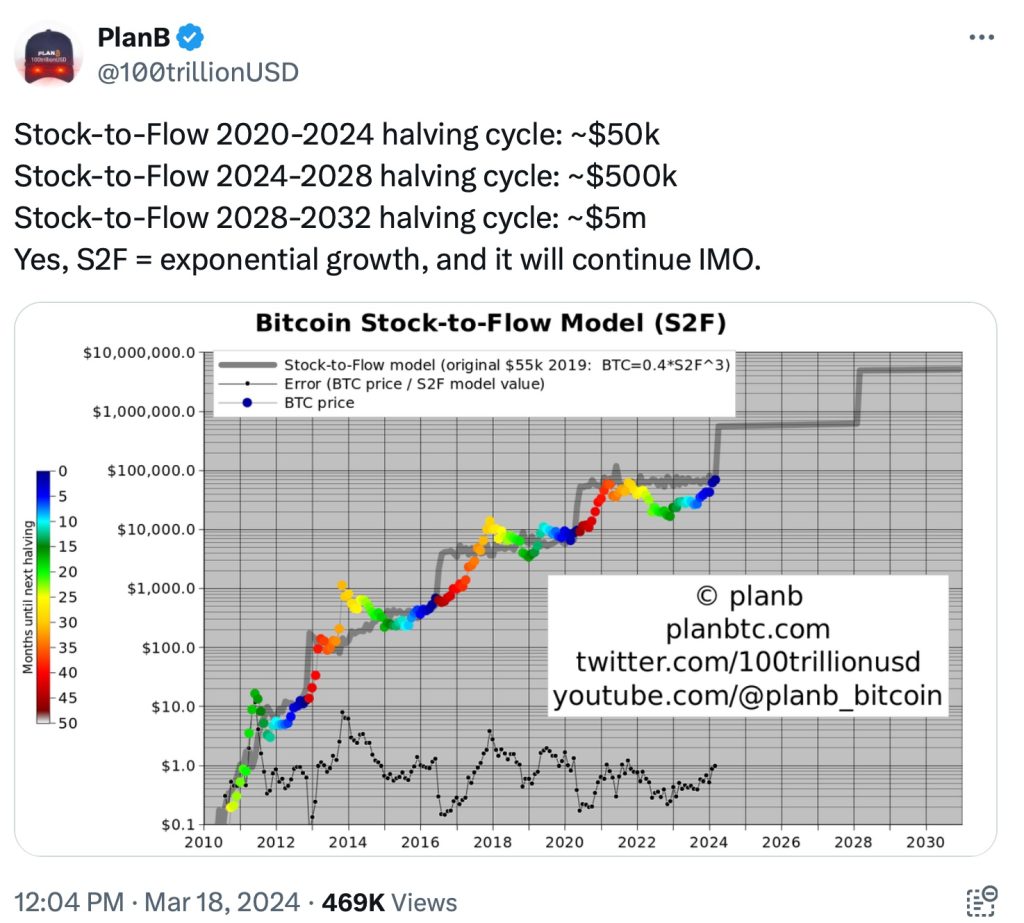
In a recent video, PlanB reaffirmed his view that Bitcoin prices will keep rising exponentially with time: a 10x with each halving cycle, according to his Stock-to-flow model. Note the contrast between this model and the earlier discussed Power Law Corridor Model, which posits that it will take BTC longer and longer to make similar percentage gains. PlanB predicts an average of 500k BTC price for the coming 4 years.
Willy Woo
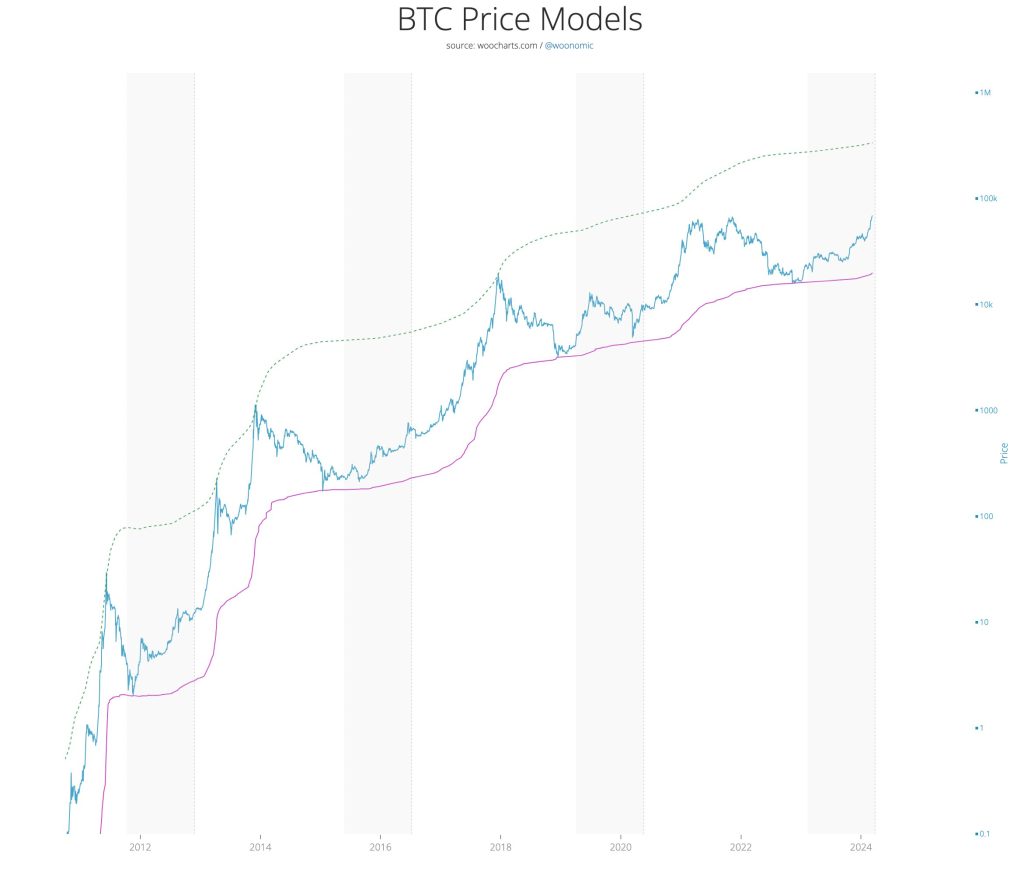
Here’s Willy Woo. Note: his model predicts a potential top of 337k, this is the highest the price could go according to his model, not necessarily his most likely top prediction.
The Gold Parity Camp: 600k Price for BTC
We started this video with a rather bearish price prediction so it’s only fitting to end it with a bullish one. Do I believe that Bitcoin’s market cap could overtake gold? Sure! Do I believe it will happen this cycle already? Not so sure…
But respected Bitcoin OGs and analysts such as Tuur de Meester and David Baily predict this. It would mean roughly a 600k BTC price. The reasons they cite are the way gold ETFs see outflows while the new BTC spot ETFs see massive inflows.
Here’s a recent chart of BTC ETF inflows compared to gold outflows, to illustrate the line of reasoning.
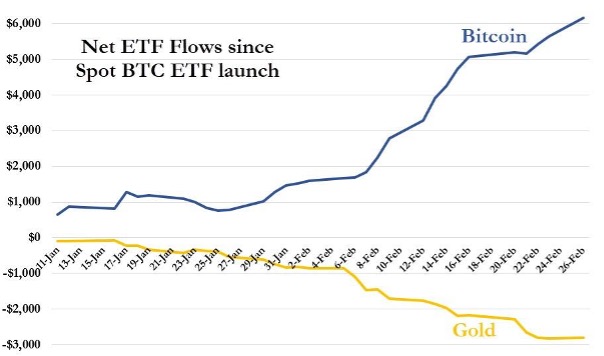
At the rate at which gold ETF is being overtaken by BTC, why not gold parity soon? 600k. Tuur deMeester and David Baily think this.
Conclusion
This was just a shortlist of price predictions but I hope you get a sense of the direction we’re headed. Liquidity is on the rise and the floodgates are open. This explains the rather bullish price targets. In fact, I came across a file of an analyst who averaged a few dozen price predictions of notable Bitcoin chartists. Their median top prediction: 245k. But surely these Bitcoiners are in their own bullish bubble, right? Didn’t every Bitcoiner last cycle predict 100k? And we only to 69% of that level. True. But wait, what’s 69% of 245k? 169k. And that’s almost exactly the 1.618 Fib level we saw earlier. Do with the info what you will

