How Far Are We in this Bull Market?
TL;DR How far in the bull market are we? Drawing from a range of both macroeconomic and on-chain indicators, we can conclude that we are smack in the middle of the crypto bull market. Top signals haven’t flashed yet: there seems to be fuel left in the tank.
Chances are you’ve noticed it: we’re in a bull market 🙂 BTC is up more than 300% since the 2022 bottom. Alts like Solana are up to multitudes of that. Does this mean it’s time to consider taking profits (never a bad idea), or is there more in the tank? To answer this question, we’ll zoom out from the big macroeconomic picture to the crypto market-specific situation.
The Bigger Economic Picture
We’re not just in a crypto bull market but also a bull market for stocks. While these assets are not totally correlated, crypto is influenced by macro conditions. So let’s look at our neighbors and try to assess how far are we in?
Fidelity’s Jurrien Timmer has looked at historical stock bull markets and averaged the percentage gains and duration.
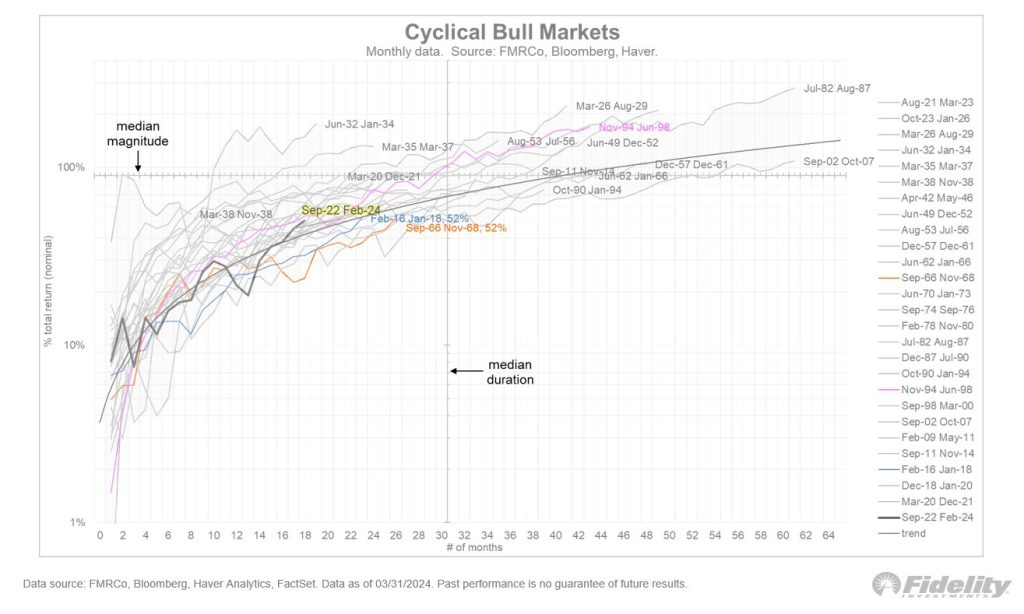
He concludes:
Over the past 100 years, the median bull market has produced a gain of 90% spanning around 30 months. By that measure there should be some life left for this cycle. [..] If 12:00 is the start of the cycle, compared to the longest cycles in history, it’s only around 3 pm right now. Based on the average cycle, it’s 6 pm.
Takeaway: we could be roughly halfway through the current stock market bull market, pointing at a top around the summer of 2025.
Liquidity on the Rise
For crypto prices to go up and keep going up, people and institutions need money floating around. In financial jargon: liquidity.
Torsten Sløk, head economist of Apollo, measures liquidity by adding up bank reserves and money market assets.
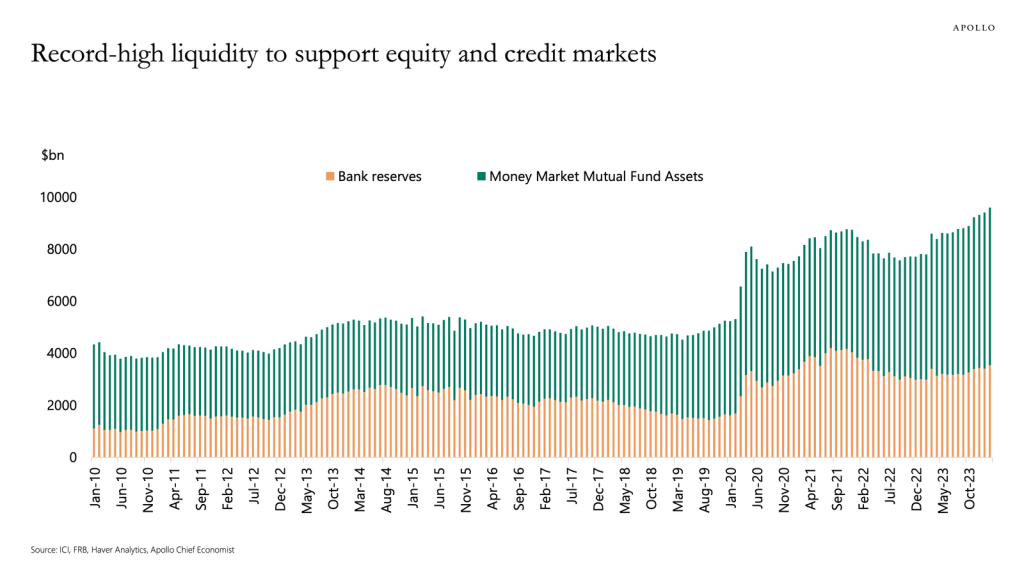
The Apollo chart shows that there is currently record-high liquidity waiting to push stock prices higher. Once the Fed starts lowering interest rates – probably later this year – some of the $6 trillion in money market funds is likely to find its way into stocks and crypto.
Takeaway: liquidity conditions point to enough fuel for a continuation of the bull market.
Catalyst: ETF Flows
There’s the flood of money across the pond, but for a sustained bull market crypto also needs floodgates. The Bitcoin ETF is such a floodgate. Since the Bitcoin spot ETFs launched in early January 2024, it has surprised even bullish-leaning analysts how successful they were.
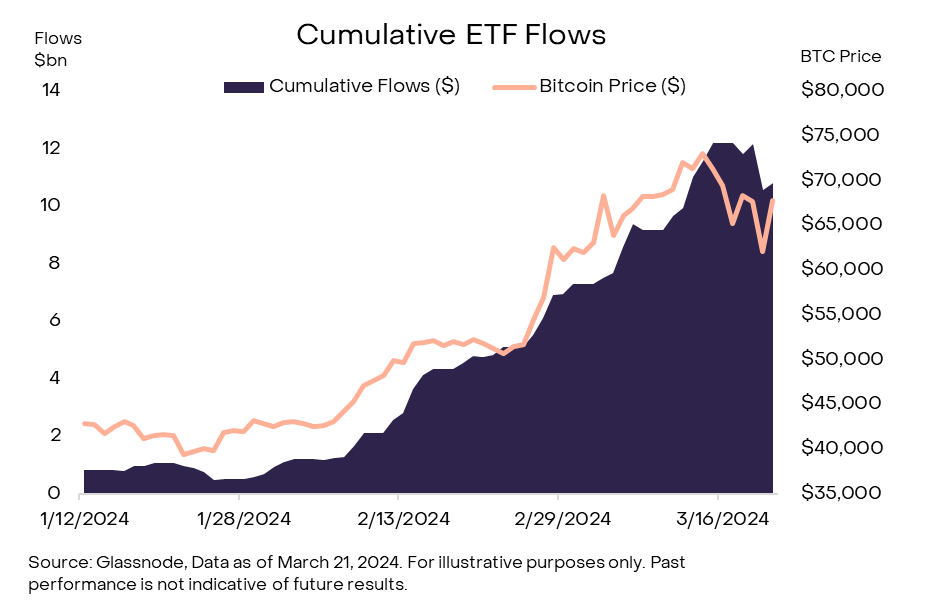
Here’s a chart from Grayscale, based on Glassnode data, showing how much the cumulative ETF inflows and the BTC price have been correlated. The question of course remains if the inflows will keep coming. Considering that it takes months for financial advisors to even be technically able to start selling these ETFs to their clients, we can expect further net inflows in the coming year.
Takeaway: the ETFs will likely keep putting upward pressure on the BTC price.
On-chain Indicators
Bitcoin Dominance
Historically, the beginning of crypto bull markets has often been marked by a surge in Bitcoin’s “dominance,” a measure of Bitcoin’s market value relative to the total cryptocurrency market.
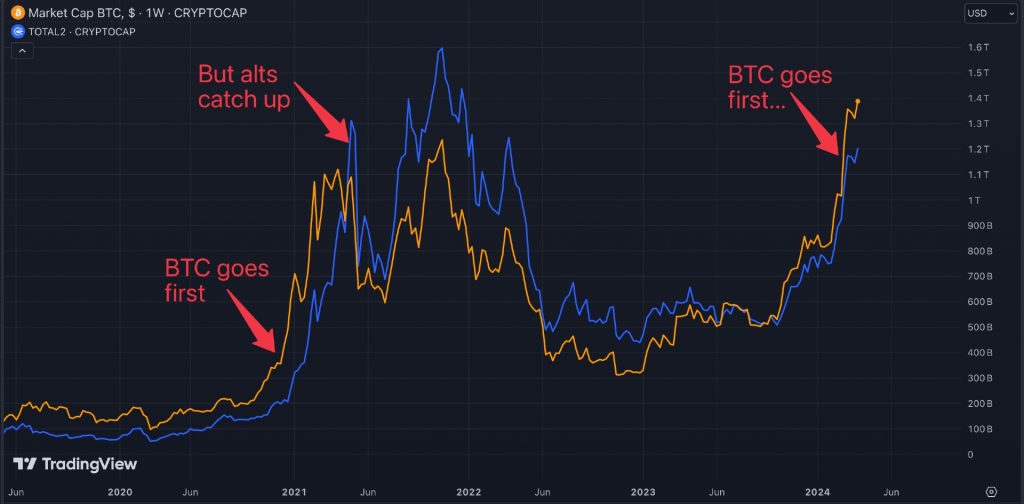
Why does Bitcoin go up first? It’s partly because it’s the least risky crypto asset and whenever global markets shift their risk appetite from conservative to daring, BTC is the first among cryptos on the shopping list. The Bitcoin halving has traditionally kicked off such a cycle. But as mentioned, also macro factors such as global liquidity play a role.
Think of it as Bitcoin throwing the first punch in a rally, and then, riding on those Bitcoin wins, investors start playing in the altcoin sandbox, hunting for the next big treasure.
- Money flows into BTC ->
- BTC starts rising ->
- BTC Dominance peaks ->
- People cycle BTC profits into Alts ->
- Altcoin dominance peaks ->
- Market tops and then starts crashing
It’s this final altcoin season phase of the bull market that we haven’t seen yet.
When we draw the dominance of BTC – the percentage it represents of the total crypto market – we see that true ‘alt seasons’ are rare. An alt season is defined as a longer period where altcoins rise much faster than BTC (measured as a percentage of the market). The last alt season we had was in early 2021.
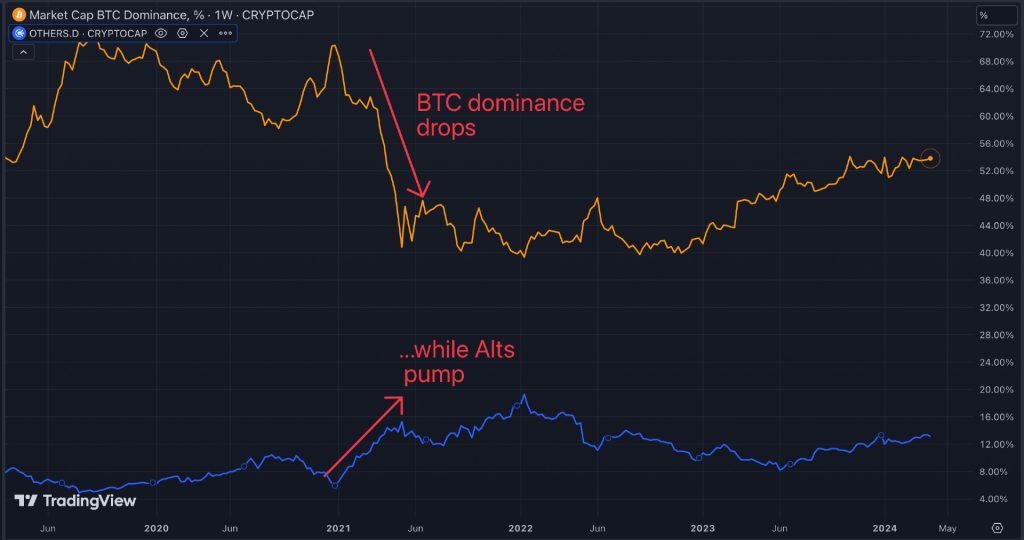
In the current bull market, BTC dominance is still on the rise. Of course, there’s no guarantee that we’ll see another massive alt season. But historically, it has happened on many occasions (including the 2017 bull market, which is not on the above chart).
Takeaway: we haven’t seen a true alt season in this bull market, suggesting that we are not yet in the final phase of this bull market.
Stablecoins and DeFi TVL
Earlier, I mentioned global liquidity. But there’s also crypto-specific liquidity. To buy coins on centralized or decentralized exchanges, for example, users need stablecoins.
When there’s a lot of ‘stablecoin liquidity’, it means there’s a lot more money in the playground ready to jump into the game, whether that’s to buy more crypto or sell some. Seeing more stablecoins floating around, especially on exchanges, is like a green light for bull markets to go wild.
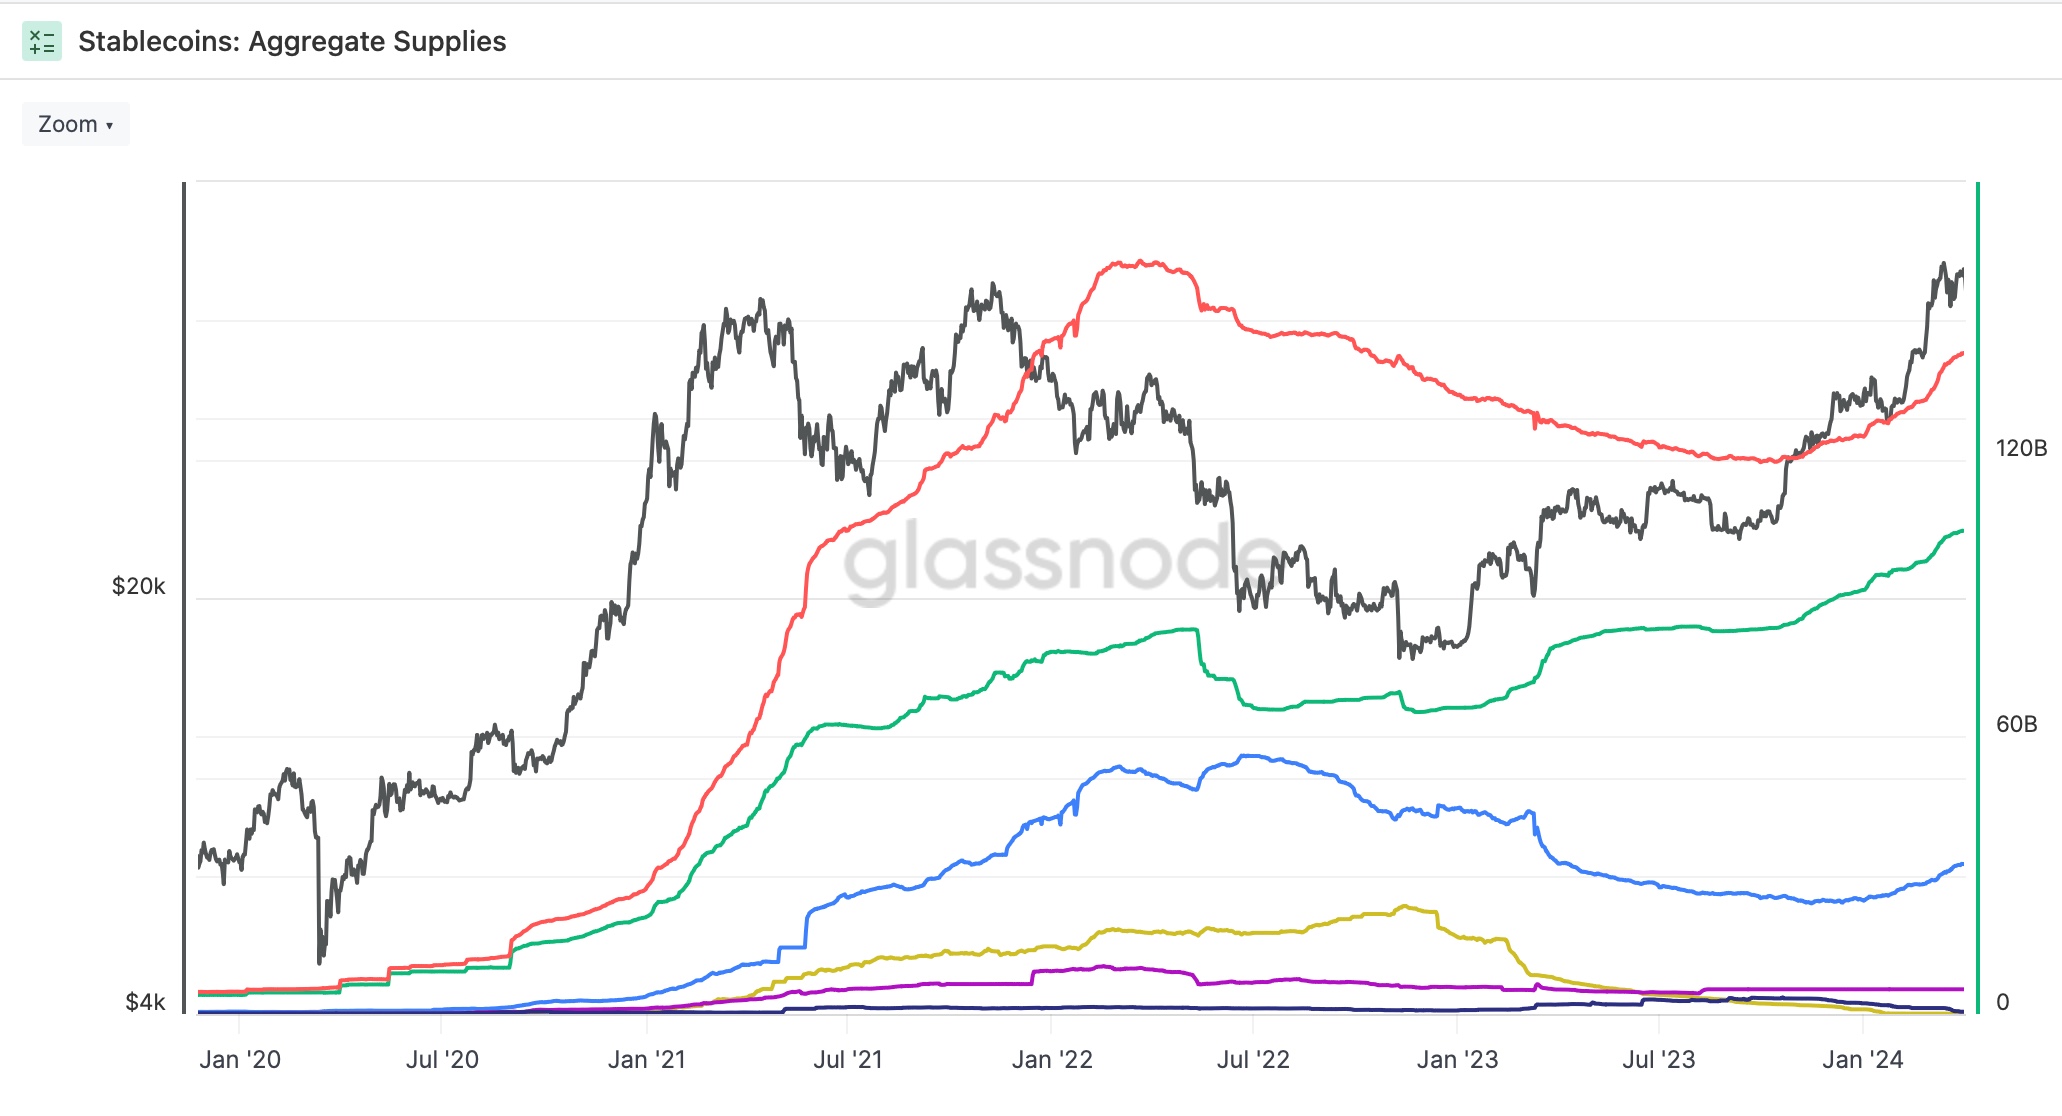
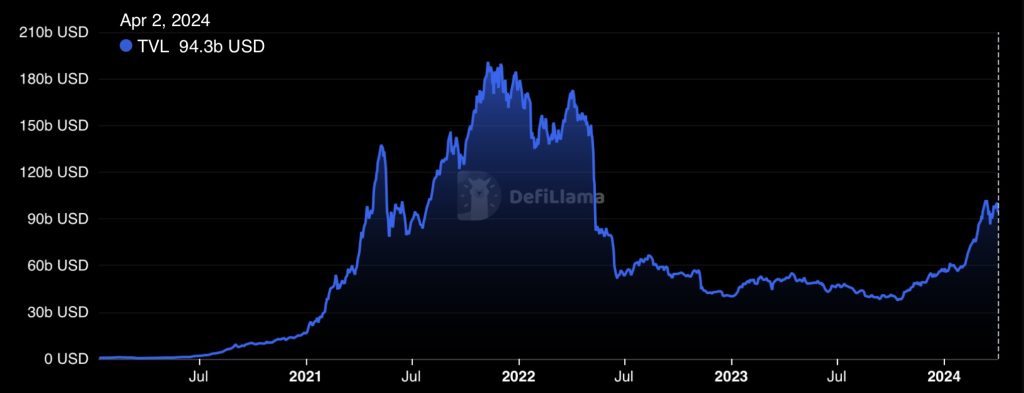
Another important indicator to gauge where we stand is the Total Value Locked (TVL) in DeFi. TVL here is pretty much the sum of all the money parked in DeFi projects. Like the stablecoin supply, it’s in an uptrend.
It shows that not only is there more cash flowing freely, making things smoother for trading and investing, but it also means more people are diving into DeFi, stirring up the pot of innovation and opportunities.
BTC on Exchanges Down
BTC that is not on an exchange, can’t be sold and drive prices down. That’s why the number of BTC on exchanges is an interesting indicator to keep track of.
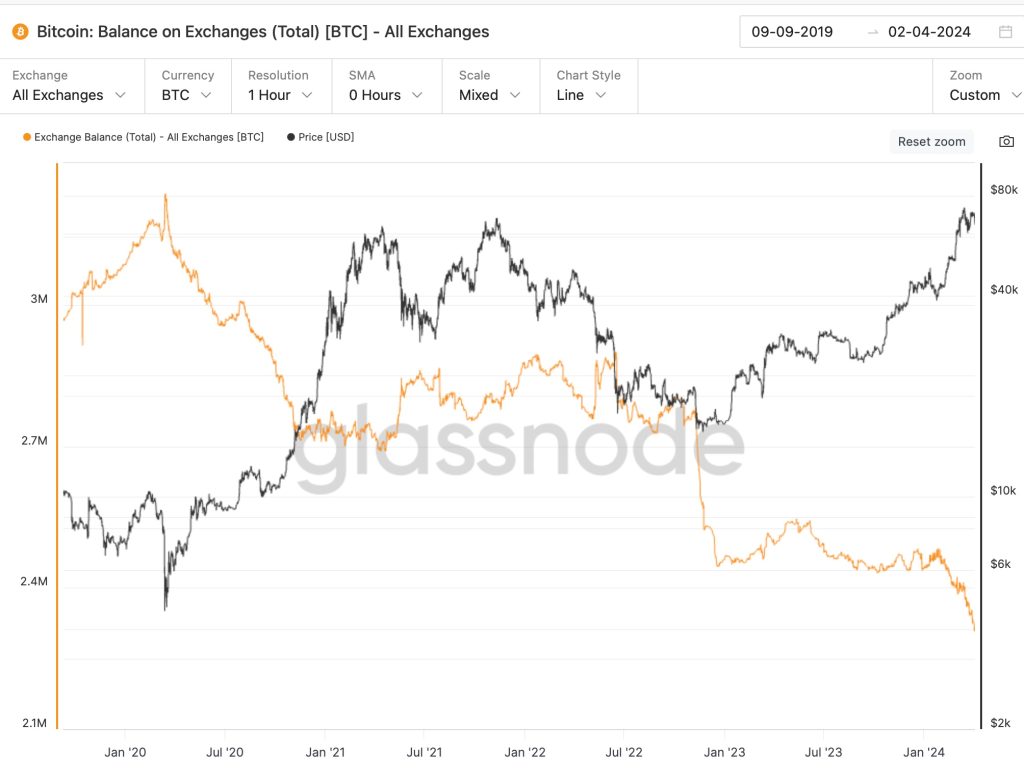
There is 7% less Bitcoin on trading platforms since May 2023. Glassnode concluded that only about 12% of all the Bitcoin out there is left on exchanges, the lowest it’s been in five years. This move away from the trading floors shows that people would rather hodl than sell for the time being.
Takeaway: stablecoin and DeFi activity, BTC on exchanges point to more runway for this bull market.
Top Signals Flashing Yet?
When bull markets get overheated and near their inevitable end, all kinds of signals tend to flash. (Stay tuned for an extensive article covering many of these).
For now, let’s discuss the so-called Mayer Multiple.
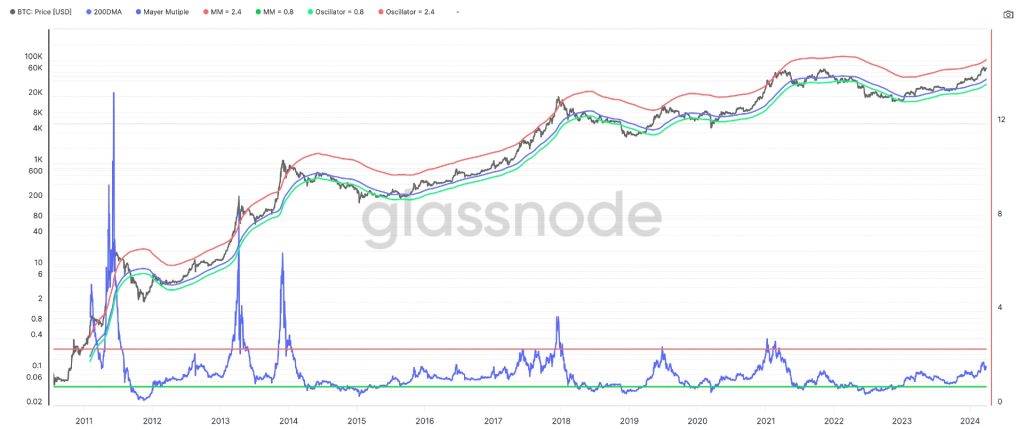
A Mayer Multiple above 1 means a price above the 200-day average, which is roughly the demarcation between bull and bear conditions (the blue line right below the BTC price line).
The further the MM rises above 1, the greater the distance between the 200-day average and the price. The higher the MM, the greater the market frenzy, implying that maybe a phase of cooling off is on the horizon. Traders will take profits and even long-term holders will cash out at least part of their holdings at a certain percentage in profit.
As you can see from the graph, we are still far removed from overheated levels that marked previous tops.
Takeaway: on-chain indicators like the Mayer Multiple don’t signal a phase of market frenzy yet.
Conclusion
Looking at both macroeconomic indicators and signals ‘closer to the blockchain’, we can assume that it is unlikely that the bull market will end in the very near future: very near future meaning weeks or let’s say two months.

