Top Signals For a Crypto Bull Market
TL;DR We’re in a bull market but we won’t be forever. If you consider selling all or some of your stash, you want to be tuned into top signals and act on them. I’ll discuss different types of top signals: technical indicators on the charts, on-chain behavior, valuation, and finally, sentiment.
If you were present during the previous bear market or even the recent pump in March, you might have felt that buzz, that almost drunken feeling of: wow, this is too good to be true. Well, it IS indeed too good to be true. The price doesn’t go up forever. Sharp price rises WILL correct sooner or later. Let’s dive into some top signals.
First Top Signal: Time
The crypto markets in the past 12 years or so have run according to a four-year cycle. Some argue it’s driven by four-yearly Bitcoin halving, others argue it’s global liquidity ebb and flow – or a coincidental combination of these two factors. Without overthinking it too much, you might just assume the four-year cycle is still in play. This would mean considering taking profit around the projected top around the fall of 2025. Read more: How Far are We in this Bull Market?
On-Chain Indicators: Holder Behavior
For the next category of top signals, let’s look at the holder base. In each bull market, old holders sell their coins to new entrants. This has to be the case, because the amount of BTC mined isn’t big enough to supply new entrants. The ebbs and flows of these holders tell us something about where we are in the bull market. Let’s look at HODL waves and Hodl growth rate.
HODL Waves
The red waves spiking in the HODL waves are like fomo visualized (hat tip for this term to Lookintobitcoin). The warmer colors are the ‘lower age’ coins, and if they spike it implies that long-term holders are fast selling to rookies. This happens when the price of Bitcoin is moving up very fast, nearing market tops.
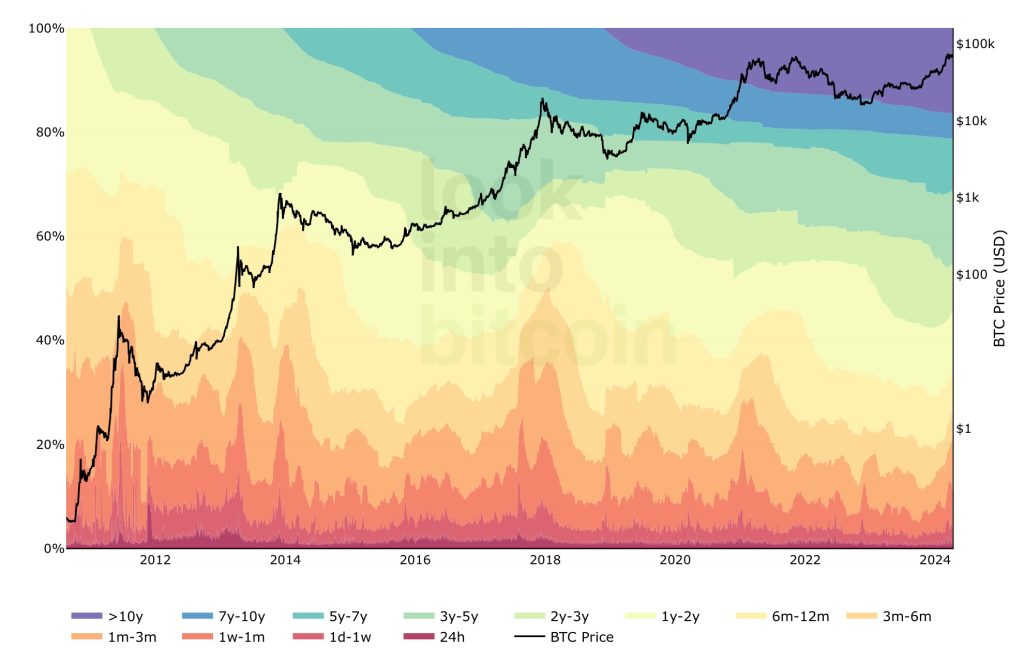
After all, the long-term holders are considered the smart money. What does it tell you when they are selling?
Currently (April 2024) we see that the red bands are moving up, which suggests a market top is rather close.
To be sure, as with all indicators, HODL waves are best used in conjunction with other indicators and analyses.
Hodl Growth Rate
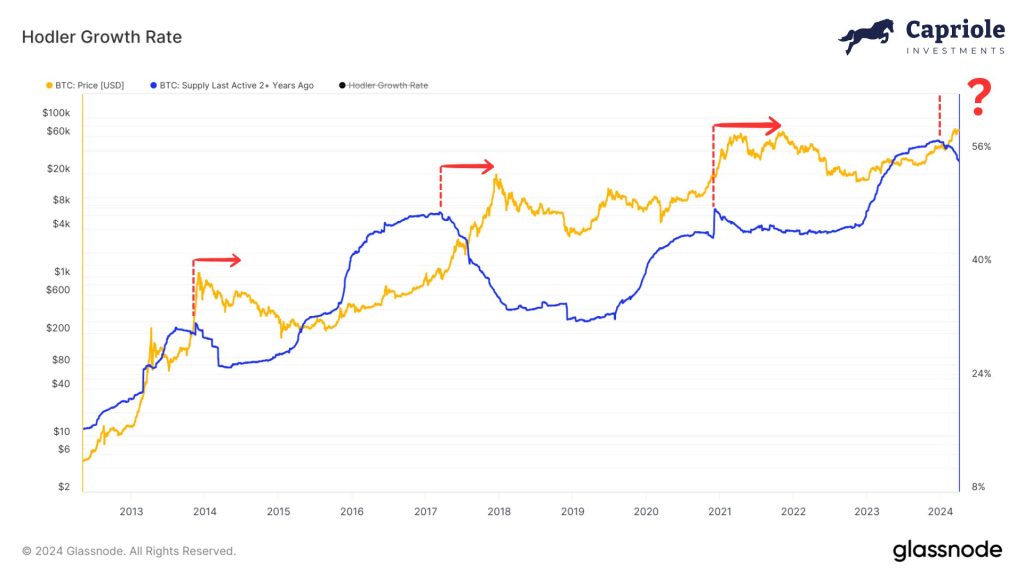
In this metric, coins by hodlers are defined as held at least two years in a row. If this number doesn’t grow anymore and starts descending, tops when Bitcoin’s diamond hands start selling into profit. That process has already begun. Cycle tops typically occur when HGR hasn’t made a new high in 6-9 months. We are 4 months in now… again signaling that a bull market top might be closer than let’s say a full year.
Network Activity Versus Price
This is perhaps the most important fundamental indicator, as it looks at how the valuation of BTC is versus the network activity. Models such as Metcalfe’s law posit a fair value of a (social) network as the square of the number of users. If the price front runs network activity too much.
Dynamic Range NVT
NVT is often called “Bitcoin’s PE Ratio”, it is the ratio of on-chain transactions to market cap. The use of dynamic range bands here helps to identify regions of under- and over-valuation (green/red). The good news: this metric is now in the value zone. How can that be, while the price has pumped so much? It’s because the network activity on BTC has also pumped a lot through the Ordinals hype.

Mean Transaction Fees
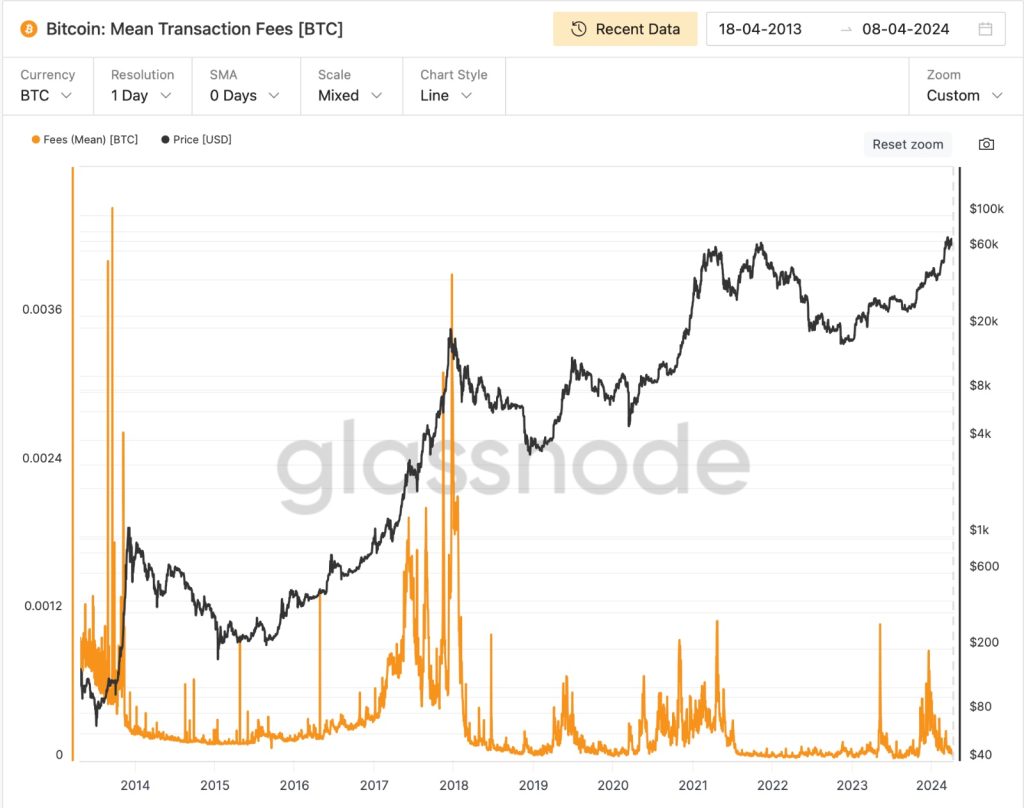
High network activity drives up transaction fees. In the past, bull market peaks coincided more or less with high transaction fee spikes. When these spikes settled down, prices went down. There are exceptions though. The mid-2023 spike was no price peak. Notice how the 2021 November top came months after transaction fees had collapsed.
Technical Indicators Based on Moving Averages
Ok, let’s look at the old-fashioned price actions, aka the charts. Moving averages are a very basic and healthy way to determine trends and trend changes.
Of the 200-day moving average, legendary investor Paul Tudor Jones said:
“My metric for everything I look at is the 200-day moving average of closing prices. I’ve seen too many things go to zero, stocks and commodities. The whole trick in investing is: “How do I keep from losing everything?” If you use the 200-day moving average rule, then you get out. You play defense, and you get out.”
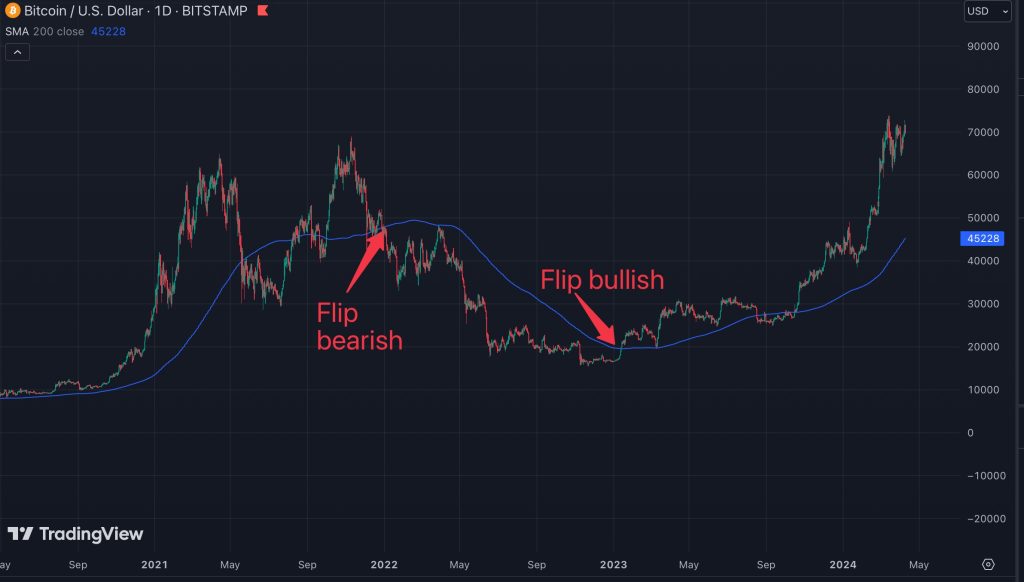
In other words, PTJ used this moving average as a defensive tool. Looking at the above chart for BTC, we see that getting out when in 2021 the price dropped below this moving average for the first time, would have gotten you an exit of around 39.000 dollars. After that, it flipped this average again to the upside. Oops… The second and final time it dropped below, it would have gotten you an exit of 47k. Both exits are decent enough, considering that you can never sell the pico top.
You could argue that Paul Tudor Jones uses the 200-day for less volatile assets such as commodities and the stock market index like the SPY.
Maybe a shorter timeframe moving average, like the 100-day would be better for Bitcoin?
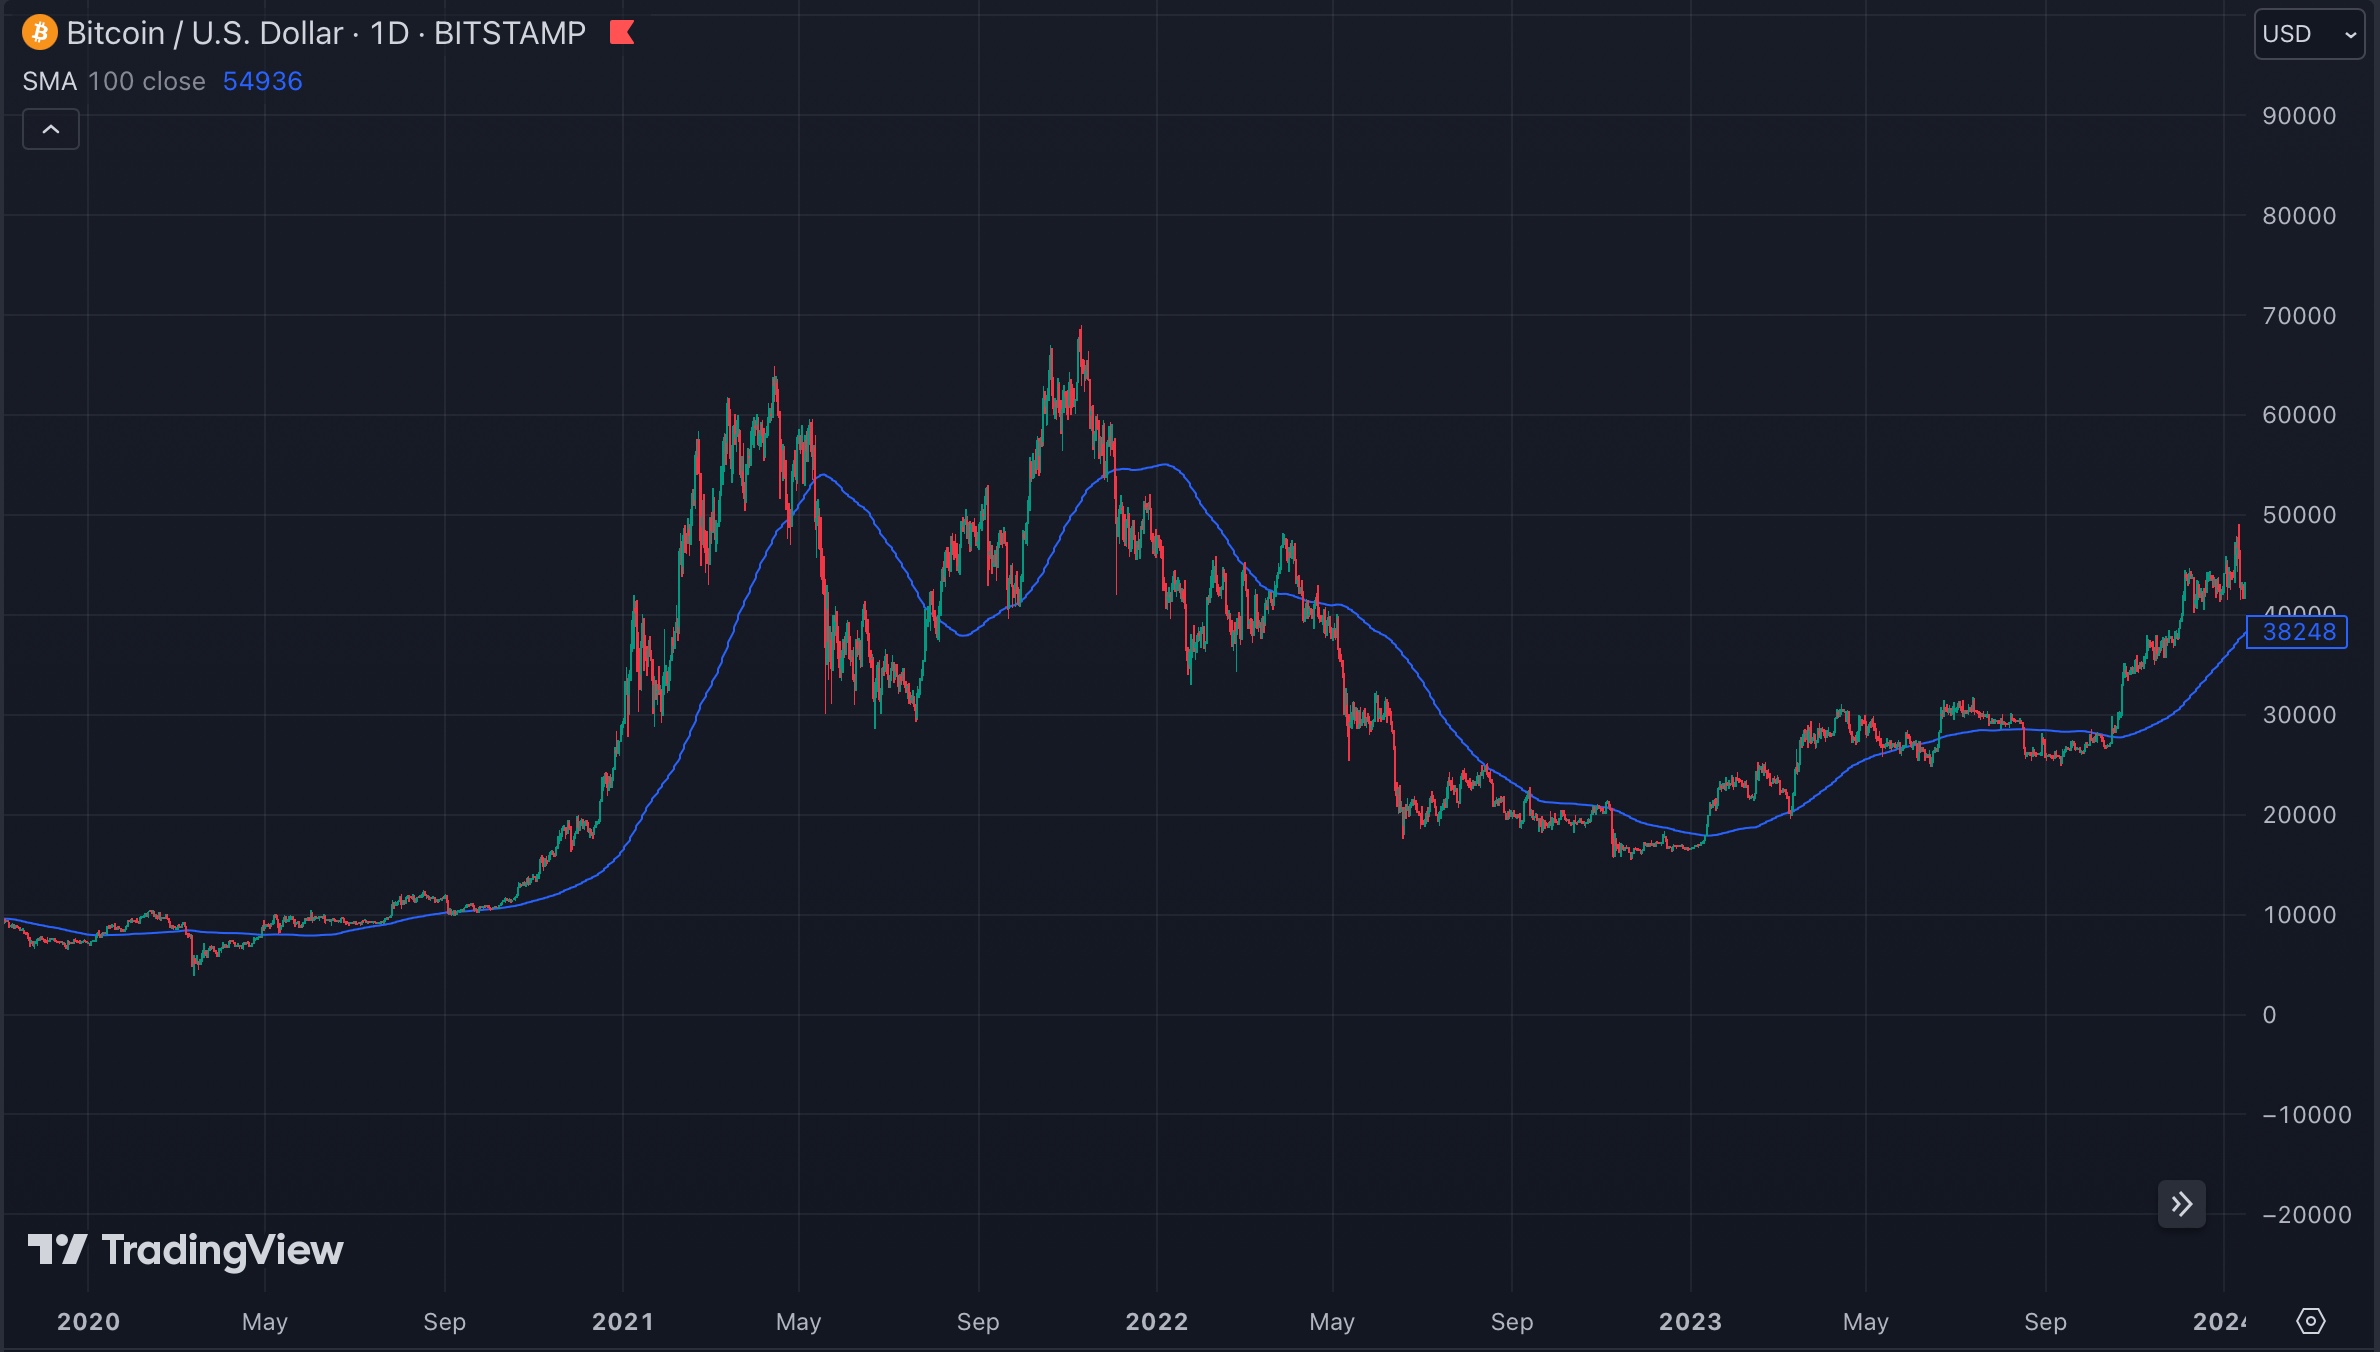
Indeed, exiting the market when it dropped below the 100-day moving average would have given you a price of roughly 53k on two occasions.
What about the 50-day moving average?
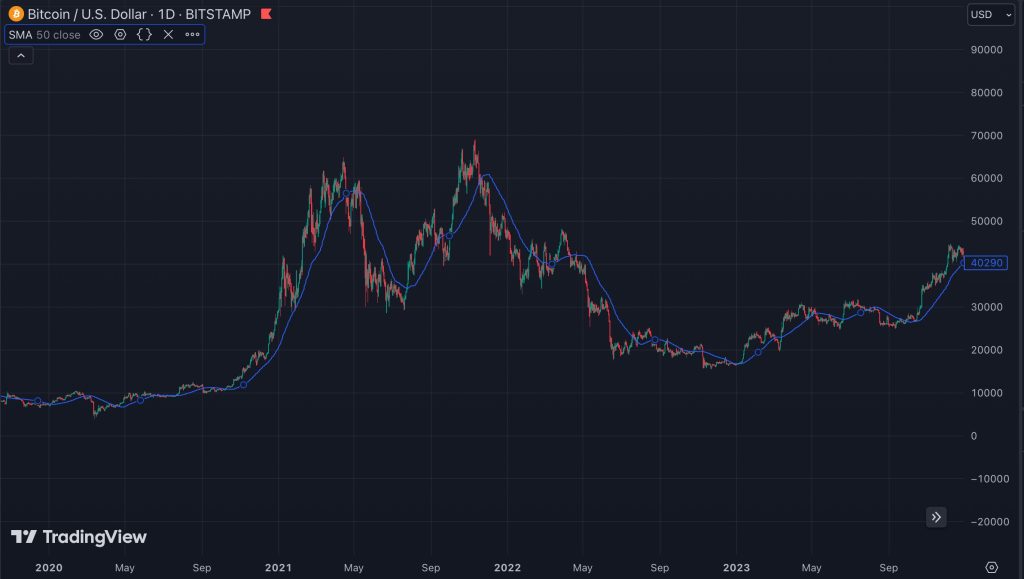
The 50-day moving average served as support for the 2020/2021 parabolic rise. When it broke for the first time, this would have been a good time to exit, at around 56k.
To conclude, while shorter moving averages give you a better exit when they first break compared to the longer ones, they are less conclusive and less reliable for longer-term trends. For example, the BTC price fell below the 50-day moving average three times before the bull market even peaked in November 2021.
Pi Cycle Top
I have to mention the Pi Cycle top indicator, it’s quite the legend among crypto market indicators. It tracks two moving averages and determines when they cross. Historically, the point in a bull market when the faster-moving average (yellow, the 111-day moving average) caught up with a 2x multiple of a slower moving average (green, the 2x 350-day moving average), we were very close to a top. It has been quite reliable – for what it’s worth. So definitely an indicator to keep your eye on.
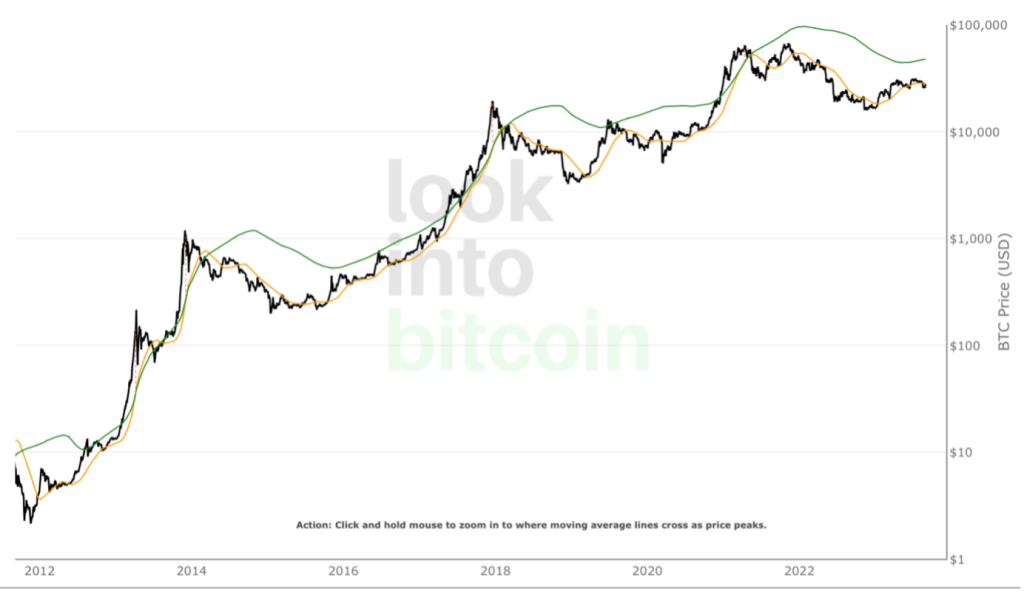
Here’s a chart of where the Pi cycle moving averages are now. They are converging again and on a collision course, scheduled around December 2024. If this happens, it could signal a top. Or, as in 2013, we could have a cycle where they cross twice and the charts paint two tops.
Mayer Multiple
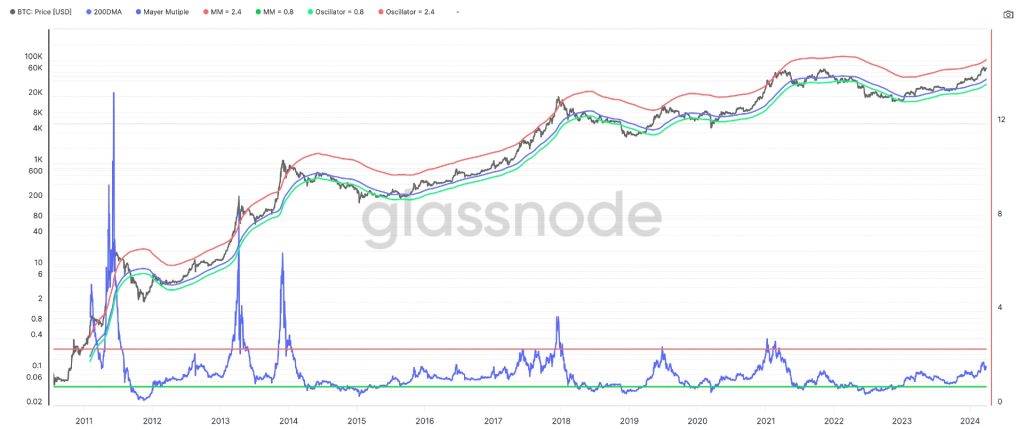
A derivative of a moving average is the Mayer Multiple, which gives us an indication if Bitcoin is overbought or not. The Mayer Multiple is calculated by taking the price of Bitcoin and dividing it by the 200-day moving average value.
Let’s say the BTC price is $10k and the 200-day moving average is 9k. That’s a Mayer multiple of 10/9 = 1.11. In other words, the Mayer multiple is really close to 1, suggesting there is no frenzy. After all, why would people be super eager to sell now? The price is close to where it has been for many months.
Mayer Multiple scores above 2.5 have marked all the major Bitcoin cycle tops throughout history. Any reading above 2.0 should be cause for caution. At 1.6 today, there should still be some room to run.
Valuation Indicator: MVRV-Z
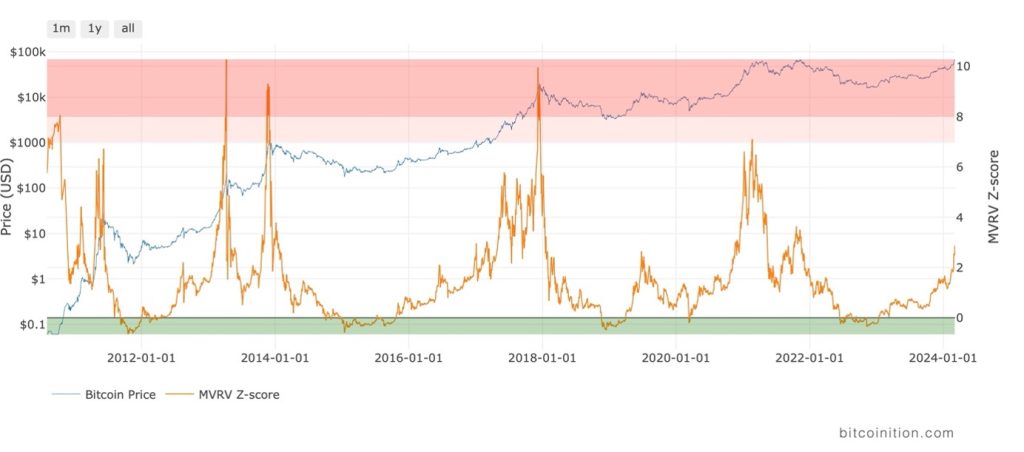
The MVRV-Z stands for Market Value to Realized Value. In short: how does the current price compare to the price of coins when they last moved? That’s another way of looking at price.
Whenever the MVRV-Z score reaches values similar to previous blow-off tops, you will know enough. We’re currently not there yet.
Sentiment Indicators: Your Inner Jim Cramer
Now let’s look at perhaps the most important category of indicators: sentiment indicators. There’s a formal and an informal way of assessing these.
Fear and Greed Index
Take a look at an indicator like the Fear and Greed Index. It’s on a scale from 1 to 100, where 100 is extremely greedy.
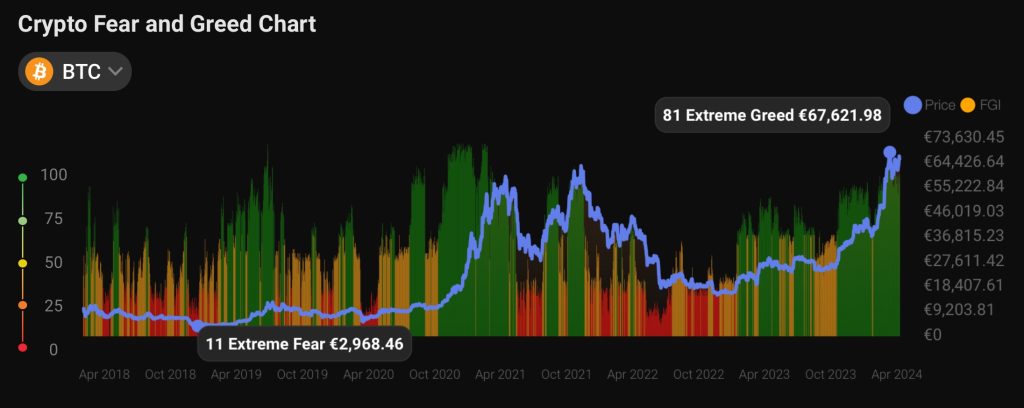
The Fear and Greed Index includes not just technical data such as momentum and volume but also tracks social media posts and search terms on Google.
As you can see in the graph, greedy (green) times coincide with fast-rising prices. Without over-analyzing the chart, it’s fair to conclude that red times are NOT for selling. If you want to sell, do it during green times.
But as a top predictor per se, the Fear and Greed index is not super useful. Look at 2017, where it stayed green for long stretches of time before the market topped.
Final Sentiment Indicator: Your Inner Jim Cramer
Jim Cramer, host of a CNBC show on finance, has become a bit of a meme in crypto circles, as he has often seemed to have yelled ‘sell!’ close to the bottom of the Bitcoin price.

Cramer has also recommended buying stocks right at their peak.
Hence, the ‘inverse Cramer’ meme, which implies that counter-trading his advice would be profitable for investors. (There was an actual inverse Kramer ETF. It stopped trading in 2024. It was of course a bit of a joke, and to be fair, it lost money. Maybe Kramer’s calls were on the whole not so bad.)

But why am I mentioning all this? It’s because Jim Cramer is the embodiment of retail investor sentiment. He’s a man of the people, so to speak. He’s emotional. On some days he’s grumpy and deflated, the next day overly excited.
We all have a Cramer inside us and we should be aware of him. If we feel the Jim Cramer inside becoming a bit too jubilant (‘This coin will go up forever!’) – this might be the top indicator we are looking for… and, inversely in a bear market: buy whenever you feel down.
Conclusion
Don’t expect the next cycle top to be the same as the last. Some of these top signals will flash near the top, some won’t. Keeping a dashboard of these metrics close at hand will help you with a common-sense assessment. Look for the weight of the evidence and stay open-minded.

