Bitcoin Dominance & Timing the Market Cycles

The bitcoin dominance obviously tells us something about the importance of bitcoin – but it also signals something about the risk appetite of investors. That is why traders and investors use the bitcoin dominance to move their money back and forth between BTC and altcoins.
What is bitcoin dominance?
It refers to the percentage of bitcoin’s market capitalization relative to the total market cap of all cryptocurrencies.
Different Bitcoin Dominance Metrics
Dominance metrics are used in many fields to gauge their competitive markets. For example, what is the Google dominance in the search engine market? That can be expressed as the Google dominance.
Indeed, why not compare Google and bitcoin dominance? Google had in 2022 a dominance of about 90% in the desktop and mobile search market. Bitcoin’s dominance averaged around 42% in 2022.
So, is Google more dominant than bitcoin? Here, the first apples and oranges problem pops up. The search engine market is more single-purpose than the crypto market. Let’s divide some use cases of crypto coins:
- Bitcoin: Fulfills the function of ‘hard money’
- Ethereum: Is ‘programmable money’
- Stablecoins: Like USDT are dollars traveling on crypto rails.
Different Metrics for Bitcoin Dominance
So, does bitcoin really compete with these use cases or is it misleading to throw all these coins in a single bucket called crypto? It’s such a mixed bag.
With this in mind, we could come up with different versions of the bitcoin dominance metric. If we narrow bitcoin’s market to proof-of-work coins, bitcoins dominance is as high as ever: around 95%. Its main competitors in this bucket are Dogecoin and Litecoin.
For this reason, there is a common alternative to the standard bitcoin dominance metric, namely the dominance metric excluding stablecoins.
But let’s park this nuance for now and move on with the standard dominance metric (BTC relative to the total market cap of all cryptocurrencies) and see how we can use it as a trader or investor.
The Early Days: Nearly 100% Dominance
There was of course a time when bitcoin had a 100% dominance. Then, based on bitcoin’s open-source code, new projects created their own blockchains and coins. In 2011, Litecoin was one of the first.
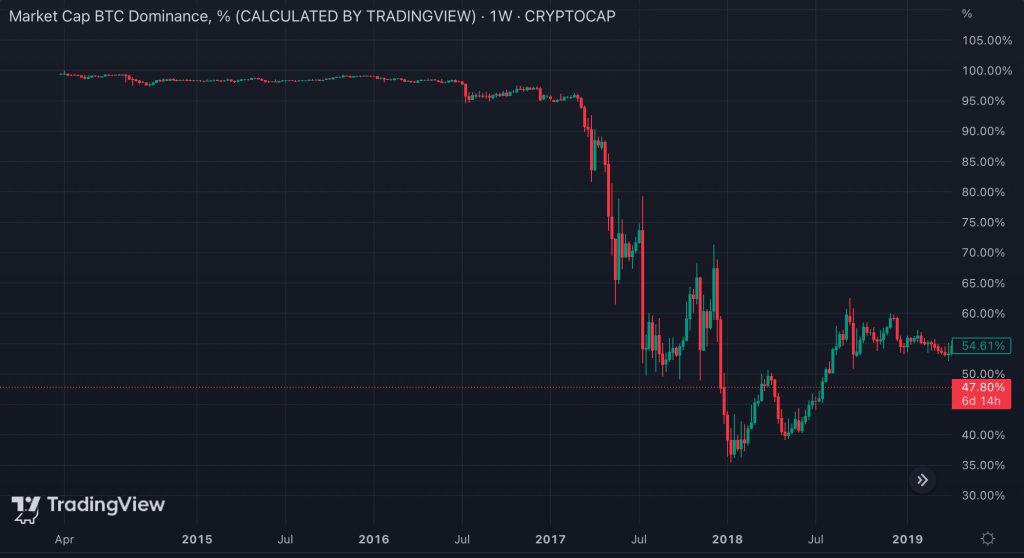
But Bitcoin dominance only really started diverging from its near 100% number when the Ethereum price took off in 2017 – see the below chart.
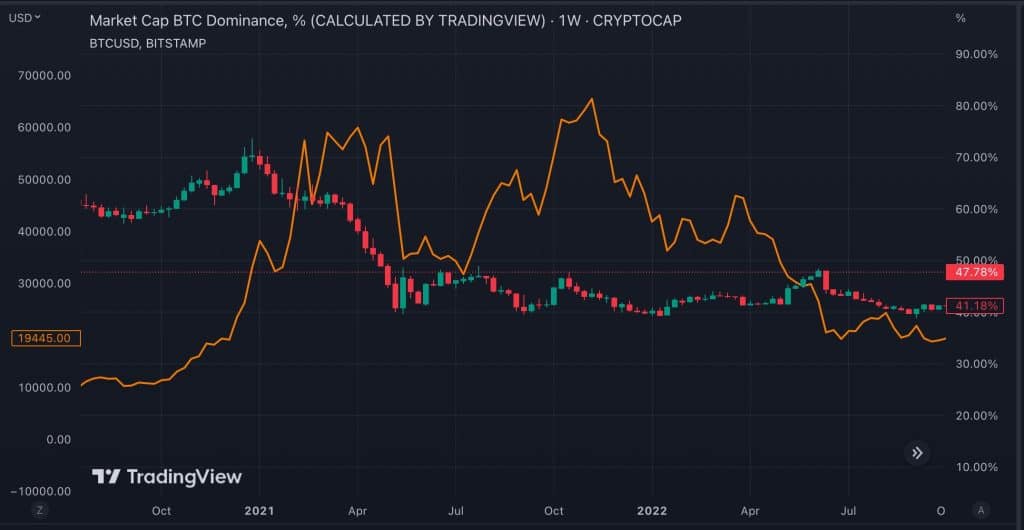
Don’t confuse dominance with price. The bitcoin price in dollars can rise at the same time that its dominance is on the decline. For example, when the bull market of 2020/ 2021 kicked into full gear, BTC’s price kept rising, but its dominance started falling (see graph below). This has been a common pattern in traditional crypto market cycles.
- At the onset of the bull market, bitcoin rises first and its dominance too.
- When the bull market is in full force, BTC loses a bit of steam and altcoins pump -> bitcoin dominance falls.
Bitcoin Dominance as Indicator of Where to Allocate Dollars
What does a rising bitcoin dominance tell you about altcoin prices? It tells you that the average altcoin is losing value when measured in bitcoin. The dollar price of your altcoin might still go up though!
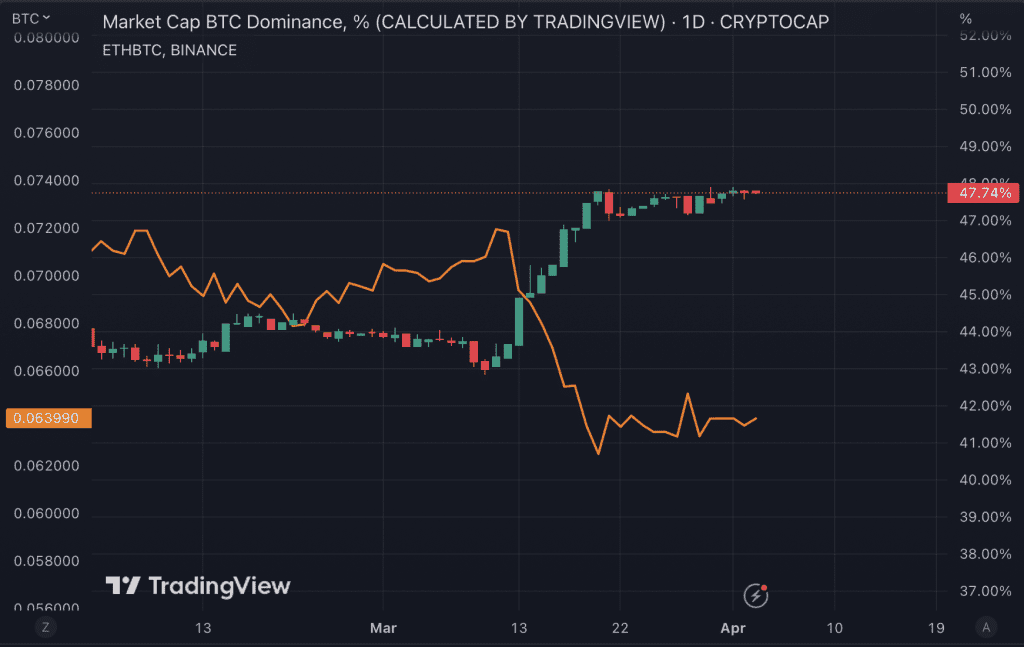
See the charts above: the bitcoin dominance and the price of ETH measured in BTC (yellow line) are inversely correlated: they are like mirror images.
What does this tell us as an investor? Let’s start with considering the point that altcoins are riskier as an investment than bitcoin. So, it only makes sense to invest in altcoins as opposed to bitcoin if the rewards are higher. Viewed like this, and generally speaking, it makes less sense to invest in altcoins in times when bitcoin dominance is on the rise. After all, why take the extra risks involved with altcoin investing (lower liquidity, more regulatory uncertainty, more uncertain product-market fit) if we can expect the altcoins to trend down in bitcoin terms?
The mirror image of this situation is in times when the bitcoin dominance is falling. In these times, it makes more sense to cycle some of your BTC gains back into alts.
A few caveats. First, as always, it depends on your timeframe. The bitcoin dominance doesn’t often move dramatically in the timespan of a few days (the above example is an exception. It was chosen to make a certain point more visually clear). So don’t be too myopic when observing the number – except when it is about to cross an important support or resistance level (see below).
Second, it’s not inconceivable that one day Ethereum will flip bitcoin’s market cap (the long-awaited ‘flippening’). At that point, these considerations will apply more to Ethereum.
Third, of course there are exceptions. Some altcoins can still pump relative to BTC against the current of a rising bitcoin dominance.
BTC Taking a Breather, Alts Pump?
It is common knowledge that if BTC price is stable, altcoins pump (btc dominance falls). This indeed has happened on a few occasions.
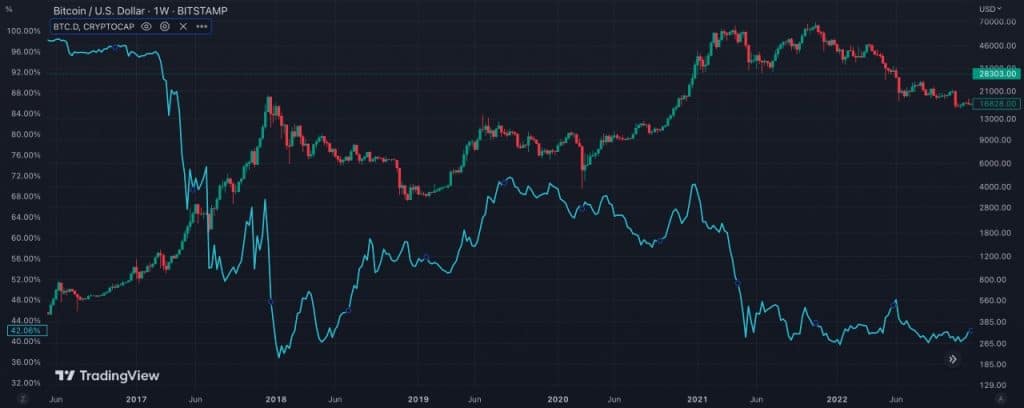
But in the above chart with BTC price and bitcoin dominance (blue line) you can see that there have been times, for example in the summer of 2018, when BTC went sideways but altcoins didn’t pump. On the contrary, bitcoin dominance rose. So, be careful not to jump to conclusions about a new alt season just because BTC is flat.
Resistance and Support for Bitcoin Dominance
By using technical analysis, we can do more nuanced predictions than simply ‘BTC flat, alts pump’. Just like we can do technical analysis on price trends of a certain coin, we can do these analyses on the bitcoin dominance. We can for example look at points where the dominance breaks support or resistance and suddenly drops or climbs, after which we’re in a new regime.
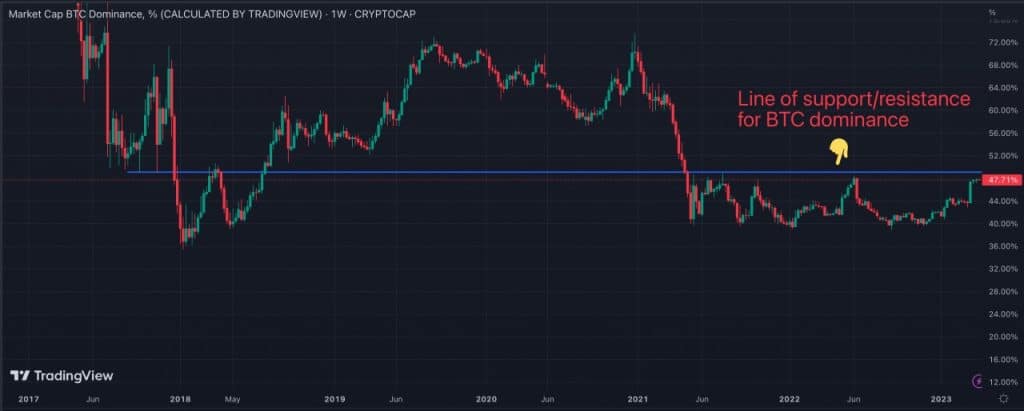
In the above graph, you can see that around the 50% dominance, there is a line that has acted as support (2017) and resistance (2018, 2021-2023). Suppose that the bitcoin dominance will cross that line again to the upside. This will leave altcoins in a weaker position: they no longer have price support in BTC terms. Again, this doesn’t mean that altcoins will lose value as measured in dollars! But measured in BTC, yeah probably.
No New Lows Since 2018 for BTC Dominance
What is furthermore interesting to note from the above BTC dominance chart, is that (analyst Benjamin Cowen talks about this too) bitcoin dominance hasn’t made new lows in recent years. The January 2018 low of around 35% is still the lowest it went – despite the rise of stablecoins in 2020 and 2021, and despite the huge amounts of VC funding of altcoin projects. A lot of analysts had predicted that BTC dominance would plummet further, but it didn’t. This brings us to a final, intriguing question.
Is Bitcoin Dominance an Oscillator or Trending Down?
As it stands (time of writing April 2023), we can’t conclude with certainty if the bitcoin dominance is an oscillator or slowly trending down. The generally accepted view is that over time, bitcoin dominance will trend down.
But let’s wait and see. If dominance breaks above 50%, it could climb quite a bit higher. The pattern would look more like an oscillator. If we would exclude stablecoins from the dominance pool, BTC dominance is even more in a solid uptrend since 2018, making higher lows since 2021.

