The Return of Solana: Quantity has its Own Quality
TL;DR
What the hell is going on with Solana? In recent weeks, it has outperformed BTC and every major altcoin. Let’s have a look at the charts and look at some usage data and current narratives about the coin that was until recently belittled as ‘Sam coin’. Let’s look at some metrics, upgrades and narratives. Spoiler alert: after Firedancer goes live there are new use cases on the horizon.
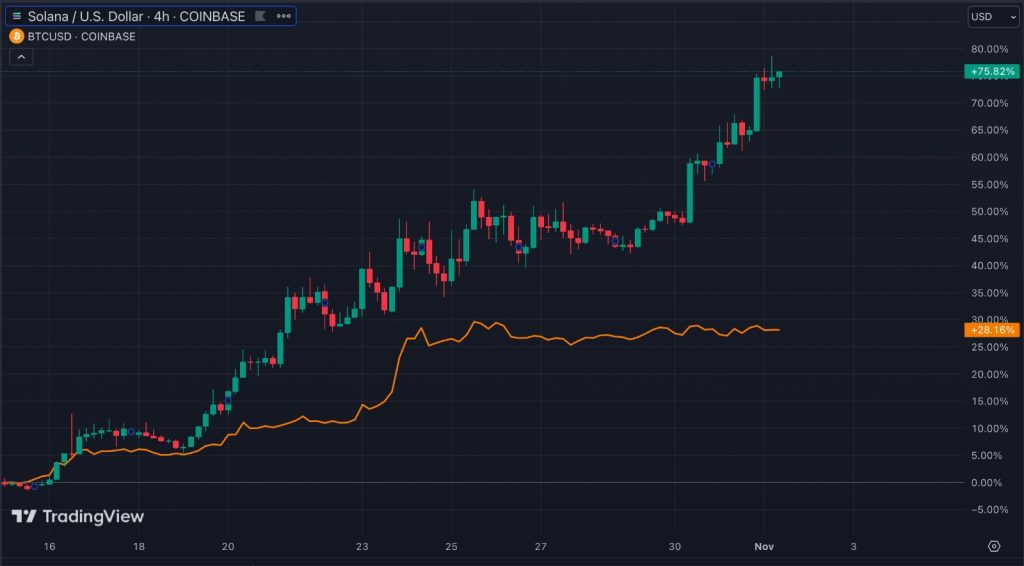
The below graph compares SOL and BTC (orange line). As can be seen, Bitcoin has been no slouch in recent weeks. Between October 15 and November 1, BTC pumped 28%. And SOL… rocketed up an insane 75%! In this early stage of the bull market, it is rare that an alt outperforms BTC, let alone by a 3x.
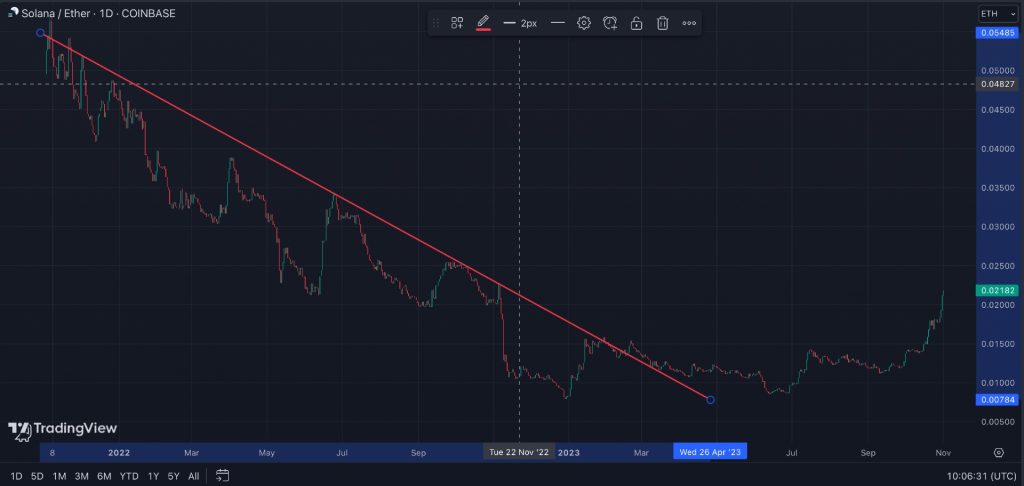
Last summer, SOL also broke its downtrend versus ETH.
That’s great for SOL. But before we get over-excited, it’s good to zoom out. Let’s plot Solana (orange line) versus Cardano (candlestick bar) and Avalanche (blue line). Why? These are, like Solana, prominent alternative Layer-1s.
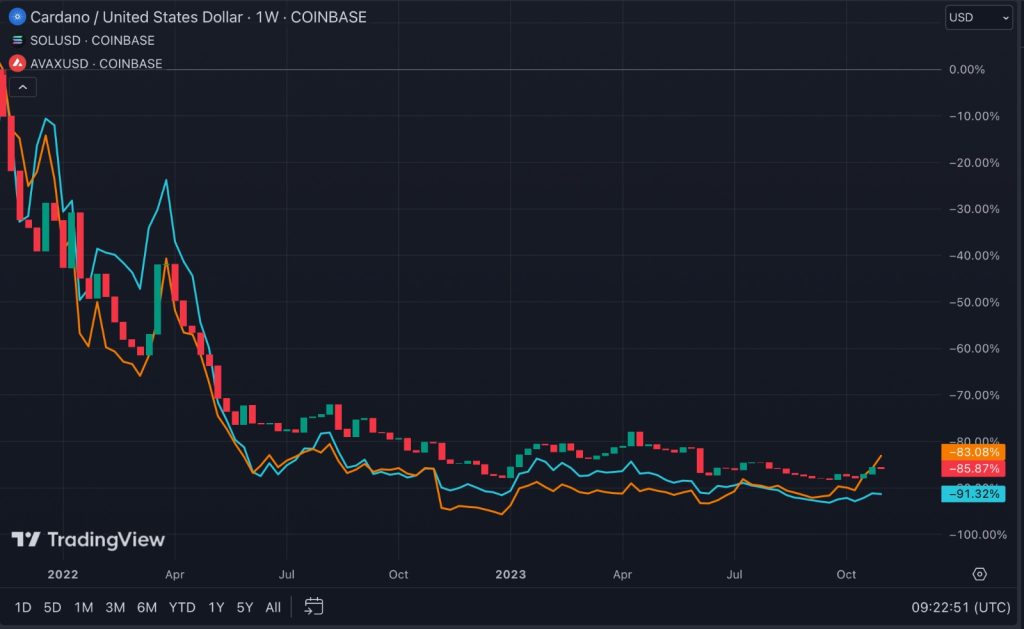
If we take the top of the bull market (mid-November 2021) as a reference point, the graphs aren’t all that different. These three alts are all down between 80% and 92% (but mind you: a relative price drop from 80% to 90% is another halving in price, so not just a marginal difference).
It’s just that Solana (orange line) has been even more volatile: it dropped further and has bounced back stronger.
Note how in June, all these alt Layer 1s crashed. It was after the SEC made regulatory complaints against Coinbase and Binance, claiming that they are a security and shouldn’t be listed on exchanges. However, ever since, SOL rallied whereas its competitors still linger around the June levels.
No Longer ‘Sam Coin’?
SOL has gotten a lot of flak in the past for being a VC token: a coin that was supposedly artificially pumped by ‘venture capital’. It was also called ‘Sam coin’, as Sam Bankman-Fried’s FTX and Alameda held a lot. Has this selling pressure been washed out?
Not quite. The SOL that is held by FTX and Alameda is subject to various unlock schedules. According to Messari, the average unlock date is in Q4 2025.
But still, the bad publicity, the ‘guilty by association’ phase is now behind us, and with Sam probably soon behind bars, Solana can move on.
Some Q3 2023 Solana Metrics
Messari published an insightful State of Solana Q3 2023 report. Some key findings:
- Solana transaction fees are still among the cheapest of all chains. The average transaction fee was $0.0002 in Q3 2023.
- At $8 billion, Solana is in second place behind Ethereum in terms of total staking market cap. Staked SOL continues to rise, and was up 2% in Q3, pretty much back to where it was pre-FTX collapse. (by the way, check out DeFi Dad’s article on SOL native staking. It talks about how to get 8% APY on the top liquid staking protocol on Solana, Marinade Finance.)
- The number of compressed NFTs (cNFTs) minted in Q3, jumped 300% quarter-on-quarter to 45 million. This type of NFT minting reduces storage costs.
- Solana’s DeFi Total Value Locked increased 32% compared to Q2, to $368 million. The growth was driven by DeFi and liquid staking protocols.
Ambitious Goals
Solana has always aimed to be a monolithic chain, setting itself the ambitious goal of singlehandedly solving the blockchain trilemma. Decentralized, secure and scalable (read: fast and cheap, ‘settlement at the speed of light’). Unlike Ethereum, Solana’s founder Anatoly Yakovenko is no fan of Layer 2’s on top of his chain. These will only fragment the user base and complicate user experience, in his view.
Adoption Milestones in Recent Months
It’s not just this narrative of settlement at the speed of light that drives current price action. It’s also what builders are building.
Companies such as Visa have started to integrate their services with Solana. The credit card company introduced in Q3 the settlement of stablecoin USDC over Solana. They previously used Ethereum… Now, Visa payments made by for example Australian customers who use the Crypto.com card are settled with Solana. Why? Visa no doubt likes fast throughput and low fees.
News from last summer is that the founder of MakerDAO Rune Christensen wants to explore a Solana fork for MakerDAO. The proposal explores a Solana fork to launch a new blockchain. Why this new appchain?
“The most important reason […] is that it will allow the MakerDAO ecosystem to use hard forks to gracefully recover from the most severe form of governance attacks or technical failures.”
This vote of confidence from a highly reputable project like MakerDAO won’t directly boost the price of SOL but it will help attract developers and/or even help fund the community.
Then there is Ethereum Layer 2 Eclipse. It settles on Ethereum using ETH for gas, but has started using the Solana Virtual Machine (SVM) for rapid execution (also, it utilizes Celestia for data scalability. Eclipse is very polyamorous).
Why is Solana Faster than Ethereum?
A quick sidestep to explain why Solana is already so fast: Solana’s Proof of History. Bitcoin’s proof of work was the first major consensus mechanism to solve the Byzantine Generals Problem (how to prevent attacks from malicious actors within the ranks). However, the founder of Ethereum believed proof-of-work was energy-inefficient and developed proof of stake.
Still, Ethereum is slow when compared to centralized databases. Proof-of-stake processing can be sped up if the network is able to execute an orderly schedule of block validators. And that’s why Solana’s proof of history was developed.
See, one problem with traditional proof-of-stake networks is that sometimes validators submit blocks at the same time. Therefore, the entire network must slow down to internally communicate with itself as the proper ordering of the blocks is established.
Solana uses Proof of History to get around this bottleneck. To avoid a situation where the network is slowed due to two validators submitting blocks simultaneously, the Solana network posts a validator schedule into the future for all to see for a given period of time.
So, it achieves blazing fast processing output by implementing a schedule, and then verifying that the schedule was followed with proof-of-history. 50 thousand transactions are currently possible.
Firedancer Testnet Live: One Million Transactions per Second
Ok, so Solana is already fast – but will be much faster. A huge deal in terms of specs and narrative that is driving pric is the release of Solana Firedancer‘s testnet in the final week of October 2023.
What will the Firedancer upgrade accomplish? Something that seems like a stretch for a monolithic chain, namely roughly a million transactions per second. Solana’s end goal of ‘synchronizing the world at the speed of light’ is getting a tad closer.
Firedancer, in development within Jump Crypto, revolves around new validator client software. A validator is a special kind of full node that participates in consensus. Being a Solana validator is not an easy task. A validator not only verifies transactions and updates that account state but also propagates and broadcasts transactions to validators across the network. The network is only as fast as you can propagate transactions.
The big technical breakthrough of Firedancer is that it implements the QUIC transaction propagation protocol. QUIC replaced Solana’s earlier and plagued transaction propagation protocol.
New Use Cases
The Solana ecosystem can’t wait until Firedancer goes live on main net. Obviously, speedier settlement will make existing applications faster. Faster DeFi is one example. To make a coin swap on your typical dex takes many seconds, while centralized exchanges are ten times faster. With Firedancer, a trade could be executed in a few tenths of a second, finally making Solana defi competitive with centralized exchanges.
But there is more: new potential use cases. There is a quote that is attributed to Joseph Stalin, of all people: “Quantity has a quality all its own”. In other words: sheer quantity of resources can open up new frontiers that were previously unattainable.
According to macro analyst Raoul Pal:
- Post Firedancer, Solana will be fast enough to run the entire securities industry.
- Solana would have enough capacity to run high-frequency trading.
- The record of Tweets per second currently stands at 143,199. The average is around 5,700 Tweets per second. So you could run entire social media empires on Solana.
These are just a few examples. The gaming industry also comes to mind.
Conclusion
While the price of SOL might take a breather and correct right at the time this article will be published, we’re looking at a bullish asset. Firedancer is a big deal. It’s quantity that begets quality. Currently on testnet, Firedancer will be launched in roughly six months. If successful, Firedancer could unlock entire new markets for the Solana ecosystem.

