Ethereum vs Cardano: Updated 2023 Comparison
Ethereum vs Cardano. Arguably the two most prominent proof of stake (POS), layer one (L1) blockchain networks in the crypto economy.
Launched in 2015 by Vitalik Buterin, Ethereum supports the most diverse Web3 marketplace in the crypto-economy. Only bitcoin surpasses Ethereum’s market-cap. In 2017, Charles Hoskinson launched Cardano, a “third generation” blockchain that aspired to displace Ethereum through better research, technical advancements, and higher performance.
Now it’s 2023, and high-time to take a fresh look at how these two protocols compare side-by-side. This article specifically explores the following:
- What are Ethereum and Cardano;
- What are their technical specifications;
- How do they compare in terms of performance and economic activity; and,
- How do they compare with regards to tokenomics and staking.
Let’s get into it.
| Ethereum | Cardano | |
| Technical Specifications | ||
| # of Active Validators | 518K | 1.5K – 3K |
| % of Staked Tokens to Overall Supply | 13% | 73% |
| Staked Token Distribution across Validators | 57% from Lido, Coinbase, Kraken & Binance | 22% from Top Ten Validators |
| Consensus Mechanism | POS via Slashing | POS via Nash Equilibirum |
| Performance & Economic Activity | ||
| Avg. Transfer Fees | $1.68 | $0.15 |
| DeFi TVL | $27.8 billion | $102 million |
| NFT Sales Volume | $35 billion | $477 million |
| Total dApps | > 3600 | > 2000 |
| Total Market Cap | $192 billion | $12 billion |
| Transactions per Second | 11.2 | 250 |
| Twenty-Four Hour Trade Vol. | $6 billion | $275 million |
| Tokenomics & Staking | ||
| Circulating / Max Supply | 122 million | 34 billion / 45 billion |
| Emission Structure | Expanding & Contracting (EIP-1559) | Inflating at 4.72% annually. Will be 0.9% by 2030. All coins minted in > 100 years. |
| % of Tokens Initially Held by Founders | 17% | 16% |
| Validator Staking APR | 4.37% | 5.36% (not adjusted for inflation) |
What are Ethereum & Cardano
Ethereum and Cardano are both decentralized, POS, L1, open-source blockchain protocols that have smart contract functionalities. Conceptualize both as global computer networks where anyone can build, deploy, and use applications (dApps) within each. On both Ethereum and Cardano, these dApps are forming ever-larger digital marketplaces where users are able to connect for commerce, entertainment, and self-expression.
Ethereum and Cardano are arguably the two most well-known POS, L1s in the crypto-economy. With 20% crypto-market dominance, a $192 billion market-cap, and the leader in DeFi and NFT sales, Ethereum has staked its claim as a flexible, economic power-house. Cardano is the third-largest POS, L1 blockchain by market-cap. The protocol is known for its superior technical performance due to advancements through peer-reviewed, academic research. Cardano has long been perceived as a possible contender to Ethereum’s market dominance.
Ethereum and Cardano’s currencies are ETH and ADA, respectively.
Ethereum & Cardano Technical Specifications
Let’s go under the hood and compare Ethereum and Cardano in terms of decentralization, proof of stake systems, and other specifications.
Decentralization
Before we get to the numbers, we’ll be using Blockwork’s metrics for POS decentralization, which is a combination of:
- The number of active validators in the network
- The percentage of staked tokens compared to total supply, and
- The staked token supply distribution across these validators.
Here’s the Ethereum vs Cardano breakdown:
| Ethereum | Cardano | |
| # of Active Validators | 518K | 1.5K – 3K |
| % of Staked Tokens to Overall Supply | 13% | 73% |
| Staked Token Distribution Across Validators | 57% from Lido, Coinbase, Kraken & Binance | 22% from Top Ten Validators |
What are we to make of these numbers?
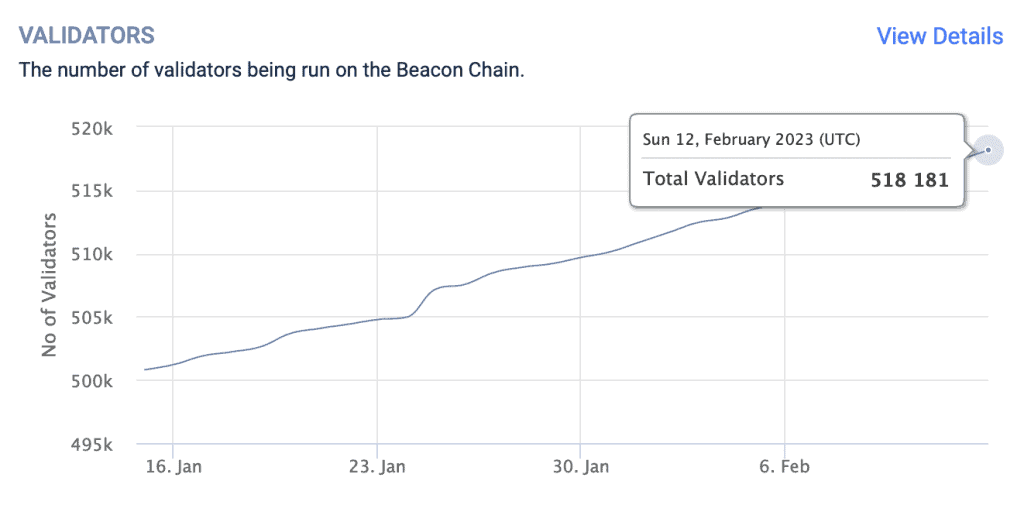
Ethereum’s large (and growing) number of active validators is encouraging. But the percentage of staked tokens to overall supply seems low. And it does appear that an awful lot of ETH is concentrated in the hands of just a few centralized, custodian depositors.
Conversely, Cardano’s number of active validators seems low. However, given Cardano uses a novel POS system (discussed below), so it’s not clear that this number is necessarily low for its unique setup.
Unfortunately, Cardano’s official explorer does not make the active validator number readily available. And there’s inconsistency across online sources as to what is this actual number. It’s also unclear if Cardano’s active validators are rising or falling over time. Having said that, the percentage of staked ADA to overall supply is very high, and there seems to be very good staked token distribution across Cardano’s validators.
Proof of Stake
Both the Ethereum and Cardano blockchains use proof of stake consensus mechanisms to validate transactions and ultimately secure their respective networks.
Both blockchains use permission-less validators. Meaning, anyone can plug into these networks to be a validator, so long they meet the proper staking and software requirements. Validators on both networks (called “stake pools” on Cardano) verify the accuracy of new blocks that are broadcast and receive rewards for propagating new blocks themselves.
Other than these commonalities, the Ethereum and Cardano POS systems are actually quite different.
Ethereum Proof of Stake
Ethereum validators must stake a minimum of 32 ETH (approx. $50K) into a special smart contract in order to run a dedicated, full, staking node on the network. This stake is used as collateral. If an Ethereum validator misbehaves (either through maliciousness or negligence), they are subject to slashing (losing their collateral).
Thus, Ethereum validators are economically disincentivized to misbehave. This economic carrot and stick approach is the fundamental security lynchpin for Ethereum and other traditional POS systems.
Cardano’s Ouroboros Proof of Stake
Cardano uses the “Ouroboros” POS consensus mechanism. In this system, validators are not subject to slashing. Rather, they are incentivized to behave properly though a game theoretic known as the Nash Equilibrium. A lot of Cardano’s peer-reviewed research went into proving the Nash Equilibrium as economically reliable. I’ll let you dive into this rabbit-hole yourself if you want further details on the Nash Equilibrium.
Cardano also uses a randomness algorithm, that itself randomly changes over time, to select Cardano’s next block validator (“Ouroborus” is the ancient symbol of the snake that eats its own tail). This algorithm is believed to provide enhanced security to the network due to the extreme difficulty in anyone being able to predict the next block validator.
L1, Open Source Protocols with Smart Contract Functionalities
Ethereum and Cardano are both L1 platforms. Meaning, L2 blockchains and sidechains can be built to interact and work with either platform. Both are open source. Anyone can inspect, study, change, or distribute the code as they please. Finally, both have smart contract functionalities. Anyone can build and launch dApps (applications that utilize smart contracts) on either network. DeFi, NFTs, gaming, and other Web3 applications owe their existence to smart contracts technology.
Ethereum vs Cardano: Performance & Economic Activity
Let’s turn to the practicalities and look at how Ethereum and Cardano compare in terms of blockchain performance and economic activity.
In terms of blockchain performance, Cardano has the advantage over Ethereum with lower transfer fees and much higher transactions per second (TPS). But in terms of economic activity, Ethereum blows Cardano out of the water. The gap between these two is crazy, especially considering Cardano is the 3rd largest POS L1 in the crypto-economy. This just proves how dominate a market player Ethereum has become.
| Ethereum | Cardano | |
| Avg. Transfer Fees | $1.68 | $0.15 |
| DeFi TVL | $27.8 billion | $102 million |
| NFT Sales Volume | $35 billion | $477 million |
| Total dApps | > 3600 | > 2000 |
| Total Market Cap | $184 billion | $12 billion |
| Transactions per Second | 11.2 | 250 |
| Twenty-Four Hour Trade Vol. | $6 billion | $275 million |
Performance
In terms of pure network performance, Cardano is the winner.
For Cardano, it seems that all the peer-review research might have paid off. The Cardano network processes an impressive 250 TPS with an average transfer fee of just $0.15. Meanwhile, the Ethereum network processes approximately 11.2 TPS with an average transfer fee of $1.68.
Economic Activity
In terms of economic activity, Ethereum is miles ahead of Cardano.
With regards to the macros, Ethereum’s total market-cap stands at $184 billion, which is approximately 15X larger than Cardano’s $12 billion. Ethereum’s twenty-four hour trade volume is currently $6 billion, a 22X over Cardano’s 275 million. Wow.
The Ethereum network has more than 3600 dApps operating, compared to more than 2000 on Cardano.
Decentralized Finance
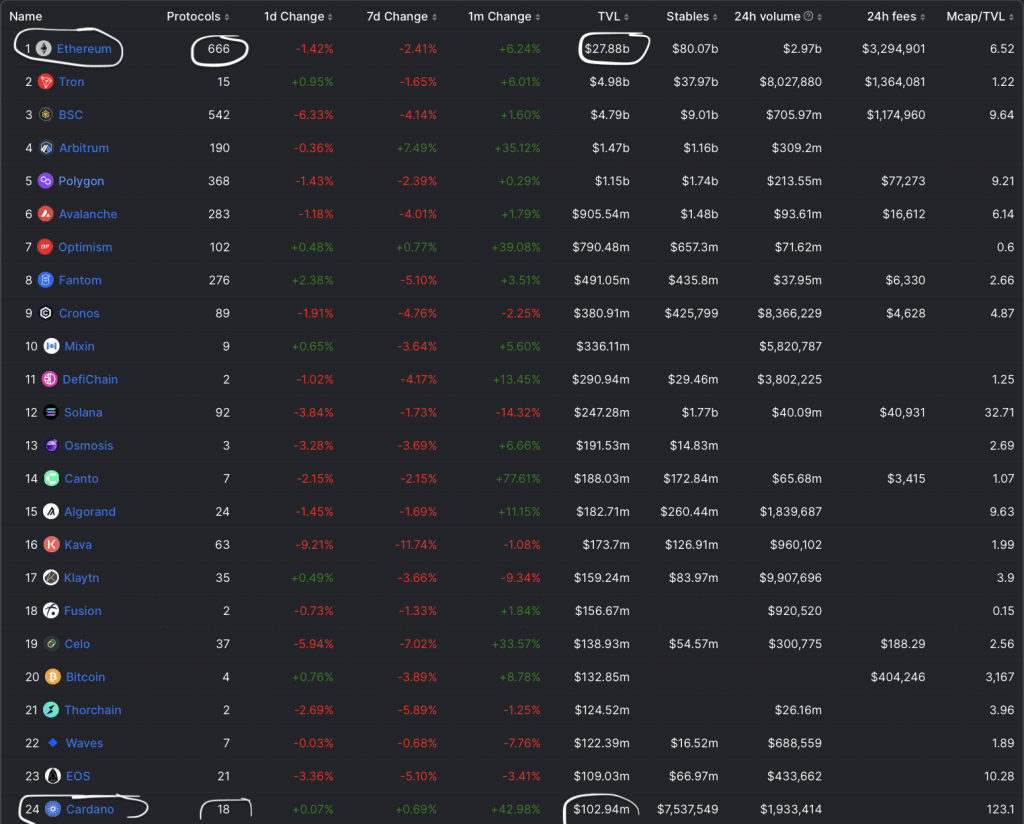
Ethereum is the King of DeFi. The network currently hosts 666 DeFi dApps with $27.8 billion in total value locked (TVL).
Cardano’s DeFi numbers are frankly embarrassing, and incongruent with its total market-cap. Currently, Cardano hosts 18 DeFi dApps with just 102 million in TVL. Cardano ranks #24 in TVL, and yet Cardano is a top 3 POS L1. This is not good.
NFTs
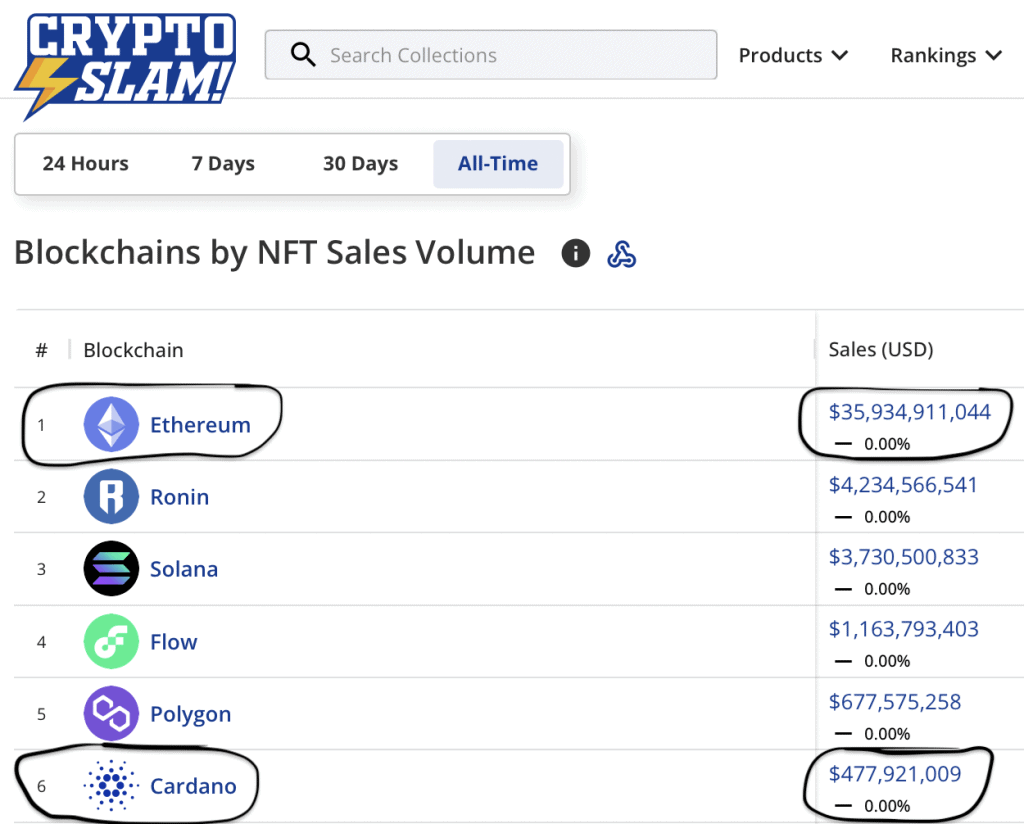
Ethereum is also the King of NFTs. The network is ranked #1 in all-time NFT sales volume by blockchain at $35.9 billion. Cardano ranks #6 with $477 million in sales.
ETH vs ADA: Tokenomics & Staking
Let’s look at the native tokens, ETH and ADA, in terms of tokenomics and staking.
ETH and ADA are very different in terms of overall supply and emission structure. However, both deserve props in terms of the initial distribution percentages between retail investors and insiders.
| ETH | ADA | |
| Circulating / Max Supply | 122 million | 34 billion / 45 billion |
| Emission Structure | Expanding & Contracting (EIP-1559) | Inflating at 4.72% annually. Will be 0.9% by 2030. All coins minted in > 100 years. |
| % of Tokens Initially Held by Founders | 17% | 16% |
| % of Tokens Staked | 13.28% | 73% |
| Validator Staking APR | 4.37% | 5.36% (not adjusted for inflation) |
ETH
ETH has a total supply of 122 million tokens. All have been minted and released. Per EIP-1559, ETH’s total supply continually expands and contracts depending on network activity. The system uses a burn-mint mechanism which burns and mints ETH during periods of higher and lower network activity, respectively.
Approximately 16 million ETH (13.28% of total supply) are locked into staking contracts. These tokens are inaccessible until the network’s Shanghai upgrade, scheduled for March 2023. Validators are currently receiving 4.37% APR by staking ETH to the network.
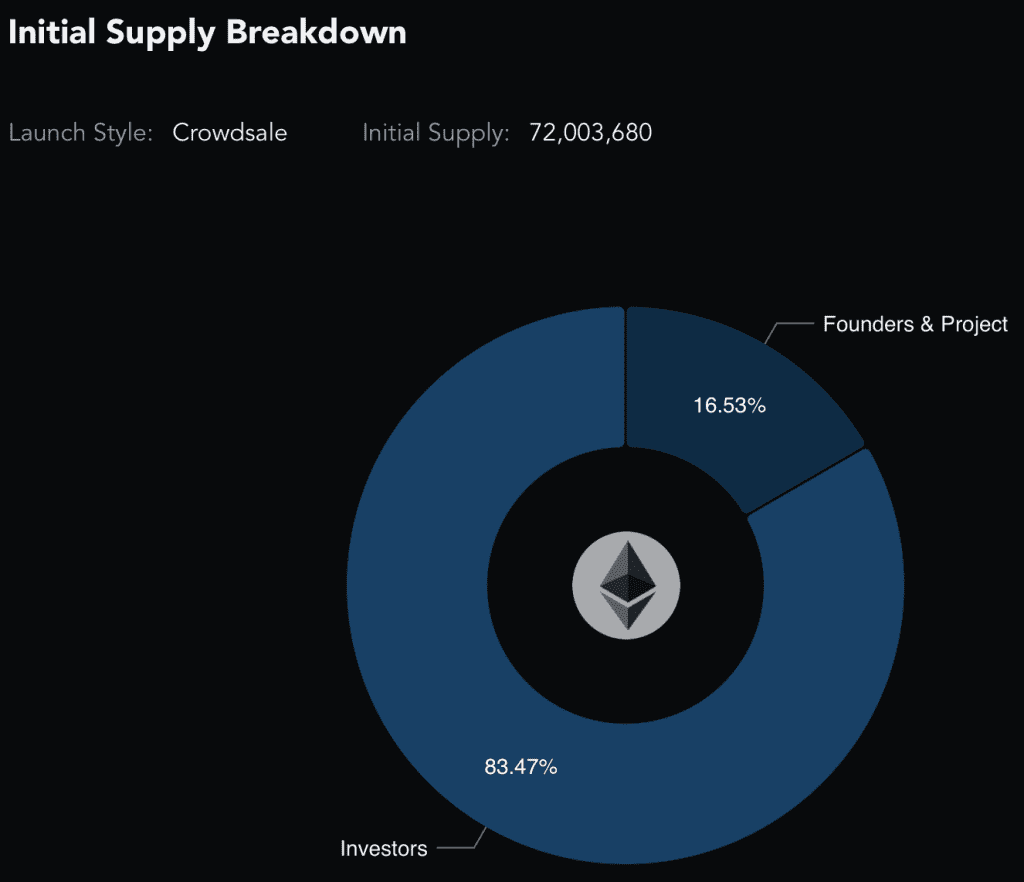
With regards to ETH’s initial allocation and distribution, approximately 83% of ETH was sold in 2015 in a public crowd sale. 17% went to the Ethereum Foundation and early contributors
ADA
ADA has a max supply of 45 billion tokens. 34 billion (76%) have been minted and released into circulation. ADA is inflating at 4.72% annually. However, this inflation rate decreases on an annual basis with the rate expected to be 0.9% by 2030. Thus, it’s expected to take more than 100 years before the max supply of 45 billion tokens is created.
Approximately 73% of the 34 billion ADA are locked into staking contracts. Validators are currently receiving 5.36% APR by staking ADA. But adjusted for inflation, the realized APR is approximately 2%.
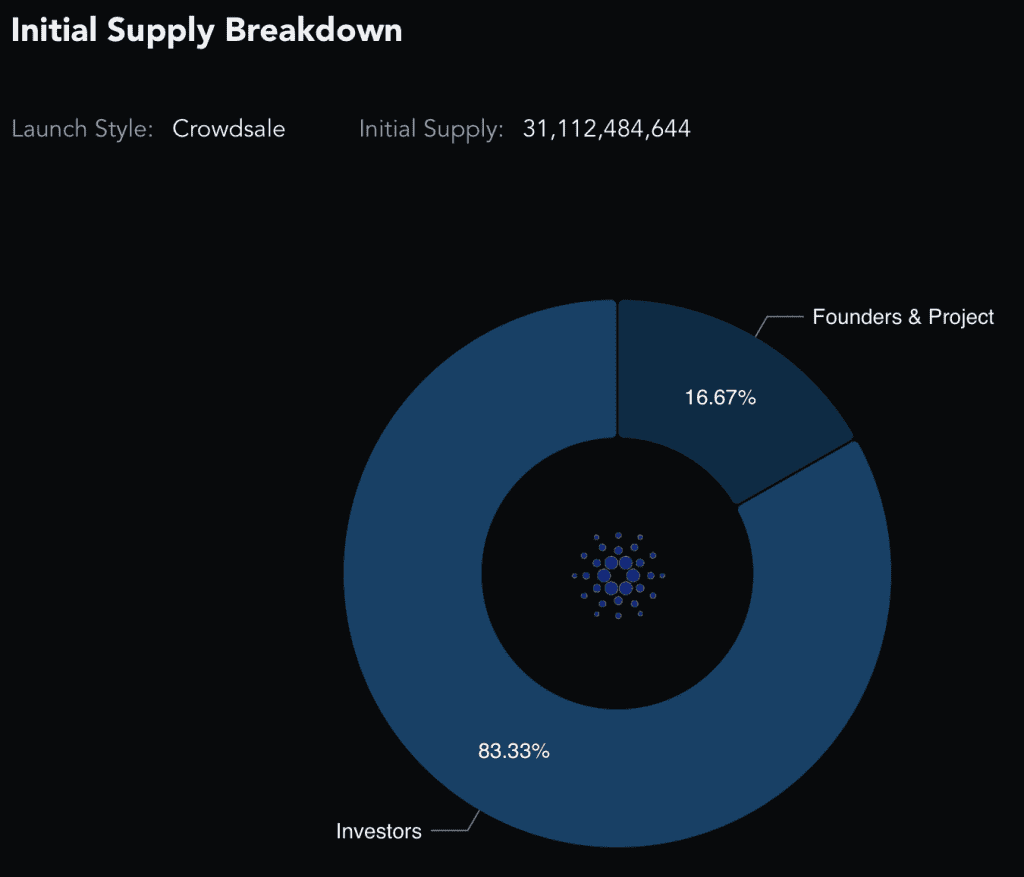
With regards to ADA’s initial allocation and distribution, approximately 80% of ADA (25.9 billion out of 31.1 billion) was sold to the public between 2015 to 2017. Approximately 16% is controlled by IOHK, Emurgo, and the Cardano Foundation (the three centralized entities in charge of Cardano’s development).
Ethereum vs Cardano: Concluding Thoughts
After a careful comparison, it’s clear that Ethereum and Cardano are in two very different stages in terms of both economic development and technology.
Ethereum is an absolute heavy-weight in terms of market metrics. By all accounts, the Ethereum 2.0 transition was successful. And network fees are now reasonable, especially considering the savings on L2s like Polygon, Optimism, and Arbitrum. It’s difficult to see any other project overtaking it any time soon.
Cardano strikes me as a technically advanced, sophisticated blockchain. The economic incentives via the Nash Equilibrium, and the randomness algorithm at the center of the Ouroborus system, are interesting and appear to be genuine developments in blockchain technology. And in terms of performance, it appears these advancements have paid off. Cardano has exceptionally low transfer fees and high TPS.
Having said that, there is a serious mismatch between Cardano’s total market cap and it’s economic numbers in terms of DeFi and NFT trading volume. The most reasonable explanation is that Cardano’s hard-core fan base has propelled the blockchain into the top-tier, even though the economic utility has not been fully captured. Only time will tell if Cardano’s marketplace can catch up to its large market cap and technical sophistication.

